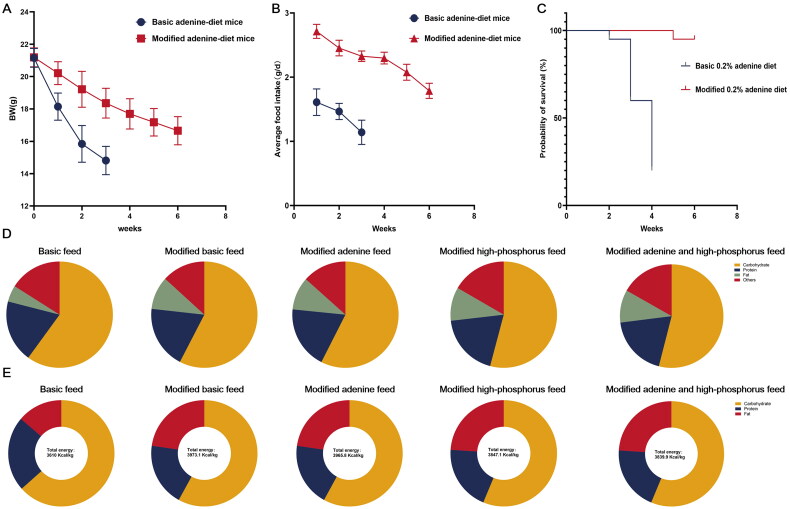
Figure 1.
Comparison between basic and modified adenine diets and compositions of the optimized diets. Changes of body weight (a), average food intake (B), and survival rates (C) in mice fed a basic and modified adenine diet. (D) Proportion of nutritional ingredients in each kind of feed. (E) Total energy and proportion of energetic substance in each kind of feed. Notes: (1) Recipe and nutritional ingredient of feed were shown in the supplementary 1; (2) the total energy (kcal/Kg) = [protein (g)*4 + carbohydrate (g)*4 + fat (g)*9]*10.

