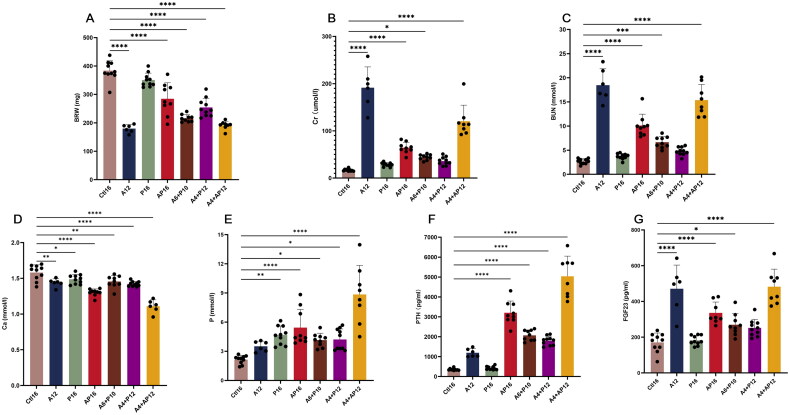
Figure 3.
Comparison of different diet modes in kidney impairment and mineral homeostasis disorder. Bilateral renal weight were shown in (a). serum levels of (B) creatinine (Cr), (C) blood urea nitrogen (BUN), (D) calcium (Ca), (E) phosphorus (P), (F) parathyroid hormone (PTH) and (G) fibroblast growth factor 23 (FGF23) were measured at the end of the experimental period. Data are the mean ± SEM. ****p<0.0001, ***p<0.001, **p<0.01, *p<0.05 vs Ctl16, determined by ANOVA with Bonferroni multiple comparison test. Samples in each group: Ctl16 (n = 10), A12 (n = 6), P16 (n = 10), AP16 (n = 9), A6 + P10 (n = 9), A4 + P12 (n = 10), and A4 + AP12 (n = 9).

