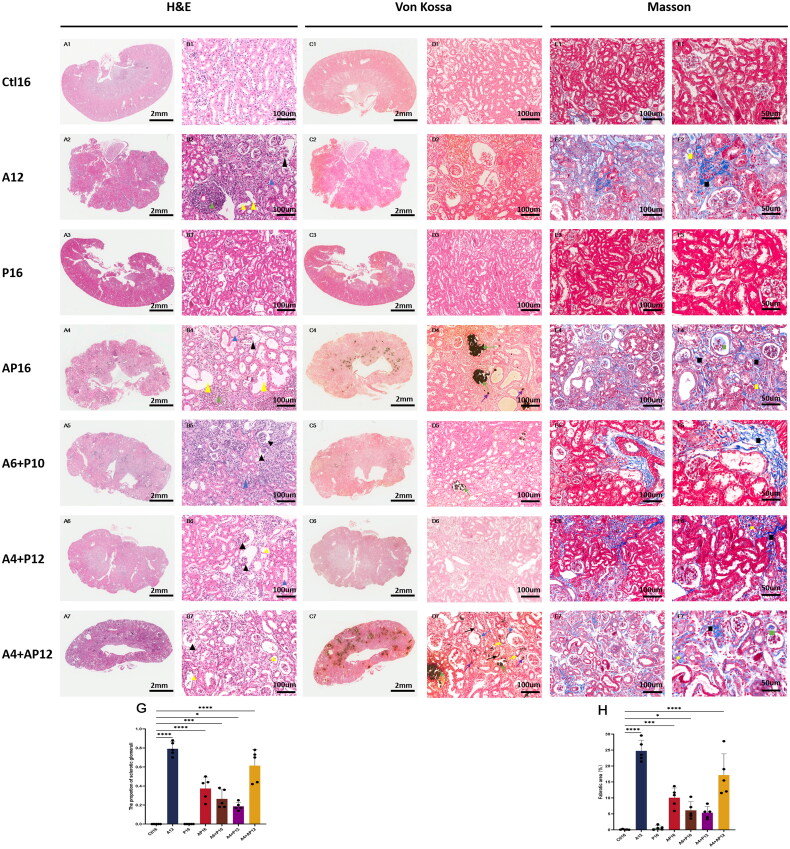
Figure 4.
Representative histopathological images in renal tissues from different groups and semiquantitative analyses of glomerulus sclerosis and interstitial fibrosis. Renal tissues were evaluated in each group using hematoxylin and eosin (H&E) (A1–7, B1–7), von Kossa (C1–7, D1–7), and Masson staining (E1–7, F1–7). Invasion of inflammatory cells (green triangle), tubular luminal expansion (yellow triangle), protein casts (blue triangle and yellow square), contracted glomerular capillary tuft (black triangle), calcified deposits in the tubulointerstitial compartment including tubular lumen (green arrowhead) and interstitial (violet arrowhead), calcification in tubular basement membrane (yellow arrowhead), parietal layer of renal capsule (blue arrowhead), and renal small arteries (black arrowhead), interstitial fibrosis (black square), matrix deposition in glomerular capillary tuft (green square). Semiquantitative analyses of kidney injury were performed according to the proportion of sclerotic glomeruli based on H&E staining (G) and the percentage of fibrotic area based on Masson staining (H). the proportion of sclerotic glomeruli were calculated as the number of sclerotic glomeruli divided by the total number of glomeruli in the same 200× field view. Fibrotic area and the total renal tissue area were measured using Image-Pro plus (version 6.0). Data are the mean ± SEM. ****p<0.0001, ***p< 0.001, **p<0.01, *p<0.05 vs Ctl16, determined by ANOVA with Bonferroni multiple comparison test. N = 5/each group.

