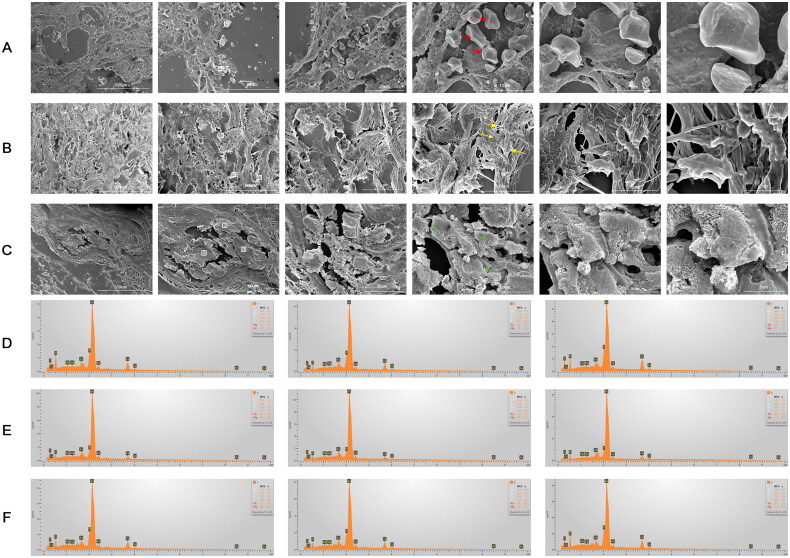
Figure 9.
SEM images and EDS Mapping analyses of kidney, aortic valve and thoracic tissues. The calcified deposition was observed in the kidney (a), aortic valve (B), and thoracic tissues (C) by SEM images. The calcified deposition in three distinct forms were labeled arrowhead with spherical particles (red arrowhead), fibers (yellow arrowhead) and compact material (green arrowhead). three regions of each tissue showing dense structures in SEM images were measured by EDS (D-F). the information of EDS spectra and their elementary composition were collected on micrographs of the kidney (a), aortic valve (B), and thoracic tissues (C) at the numbered sites labeled 1-3 (D), 4-6 (E), 7-9 (F), respectively. These structures contained an abundance of oxygen, carbon, calcium and phosphorus in descending order by content, with small amounts of magnesium and sodium.

