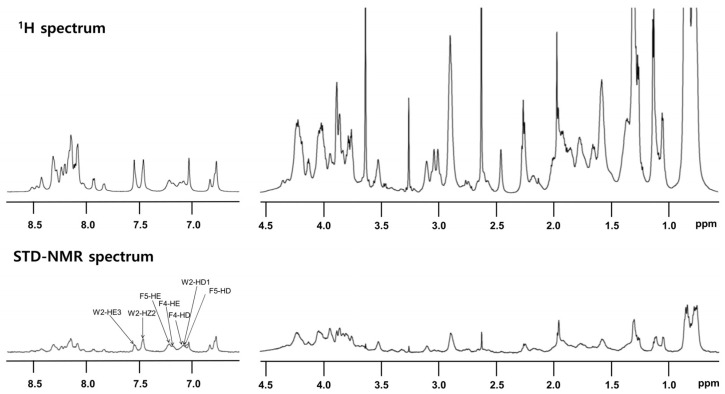
Figure 6.
Reference one-dimensional nuclear magnetic resonance (NMR) spectrum for T. ni cecropin (top) and saturation transfer difference (STD) NMR spectrum obtained through interaction with LPS (bottom) dissolved in 20 mM sodium phosphate buffer (pH 5.9). Two regions corresponding to amide protons and aromatic ring protons (left side from 6.5 ppm to 9 ppm) and aliphatic protons (right side from 0.5 ppm to 4.5 ppm) are shown.

