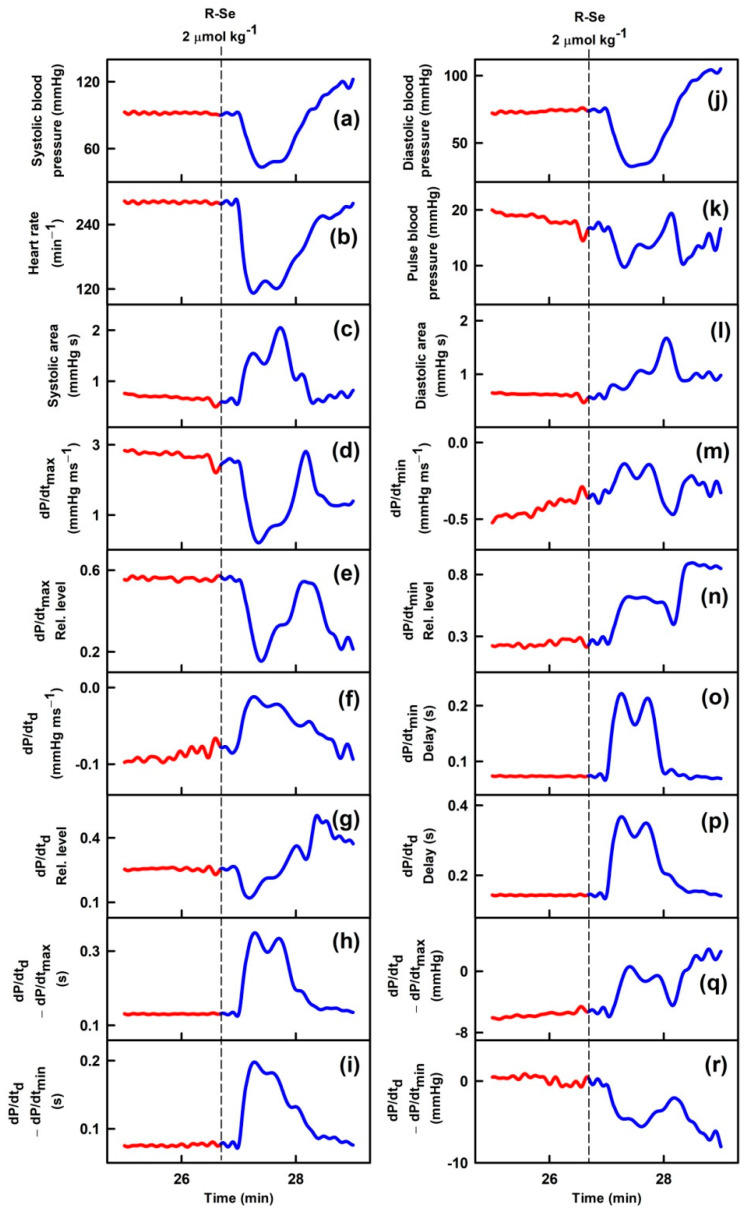
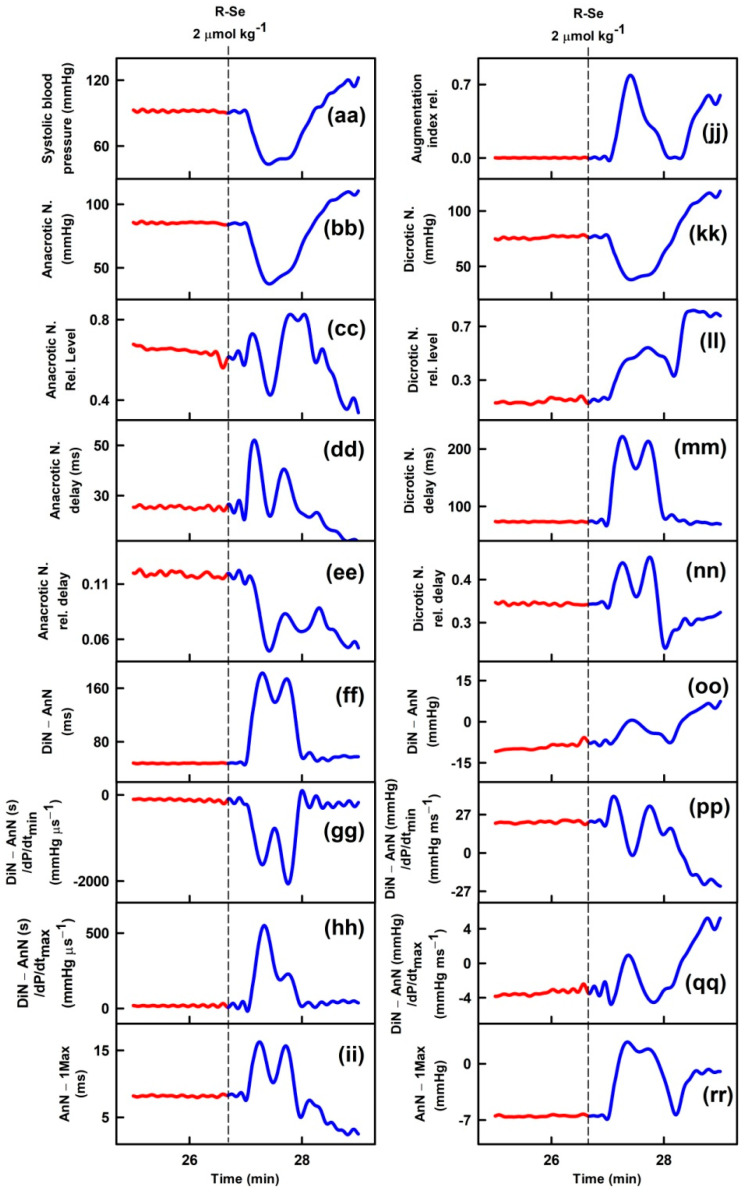
Figure 2.
Time-dependent changes of 35 APW-Ps of anaesthetized rats before (red) and after intravenous bolus (15 s) administration of 2 µmol kg−1 R-Se (blue). Vertical dash lines indicate the start of R-Se administration. Abbreviations, definitions, and units of measured APW-Ps from the APW are explained in [51,52] and briefly in Figure S1.


