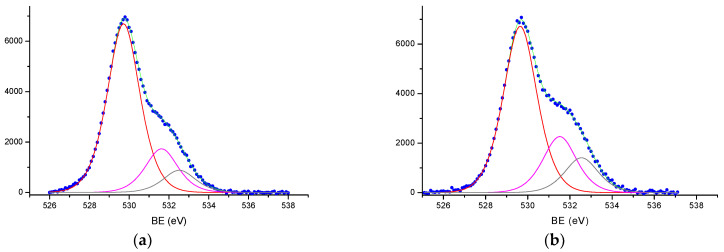
Figure 8.
The XPS spectra of O1s from the surface of hematite samples and the results of curve fitting procedure: (a) Fe2O3-900 and (b) Fe2O3-1100. The experimental data are shown as blue dots, the results of the spectra fitting are shown as solid green lines, the O1s spectra were decomposed with three elementary peaks (red, crimson and black lines).

