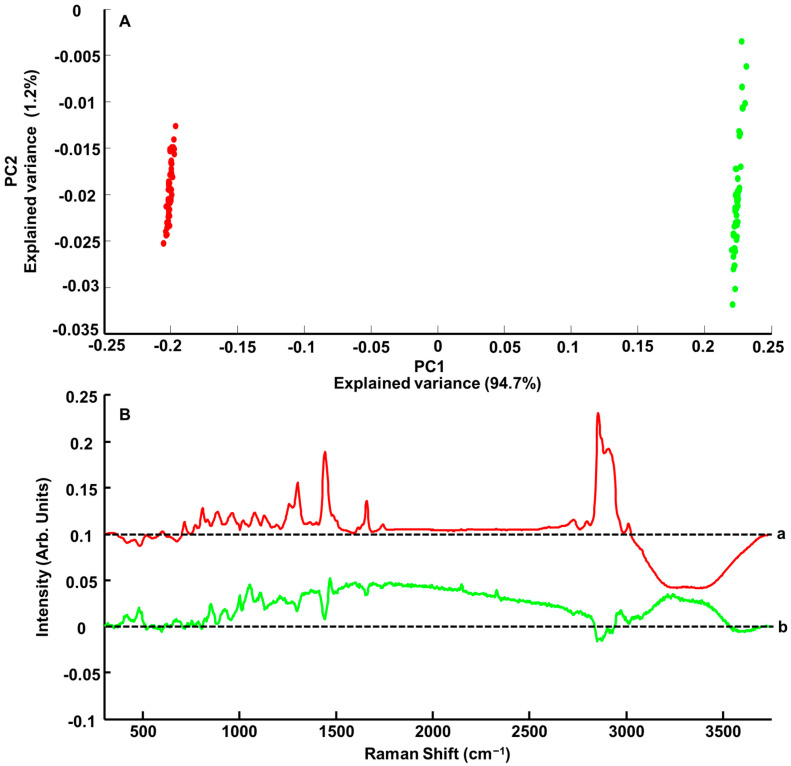
Figure 3.
(A) Scatter plot (PC1 versus PC2) from PCA analysis performed on pre-processed Raman spectra collected from ANC-PE hydrogel SET 01-C1 (0.402% w/w PE) (red dots) and ANC-PE hydrogel SET 01-C8 (8.331% w/w PE) (green dots). (B) PC loading 1 a, and PC loading 2 b over the range of 300–3750 cm−1. Dotted lines indicate the zero level. Spectra have been offset for clarity.

