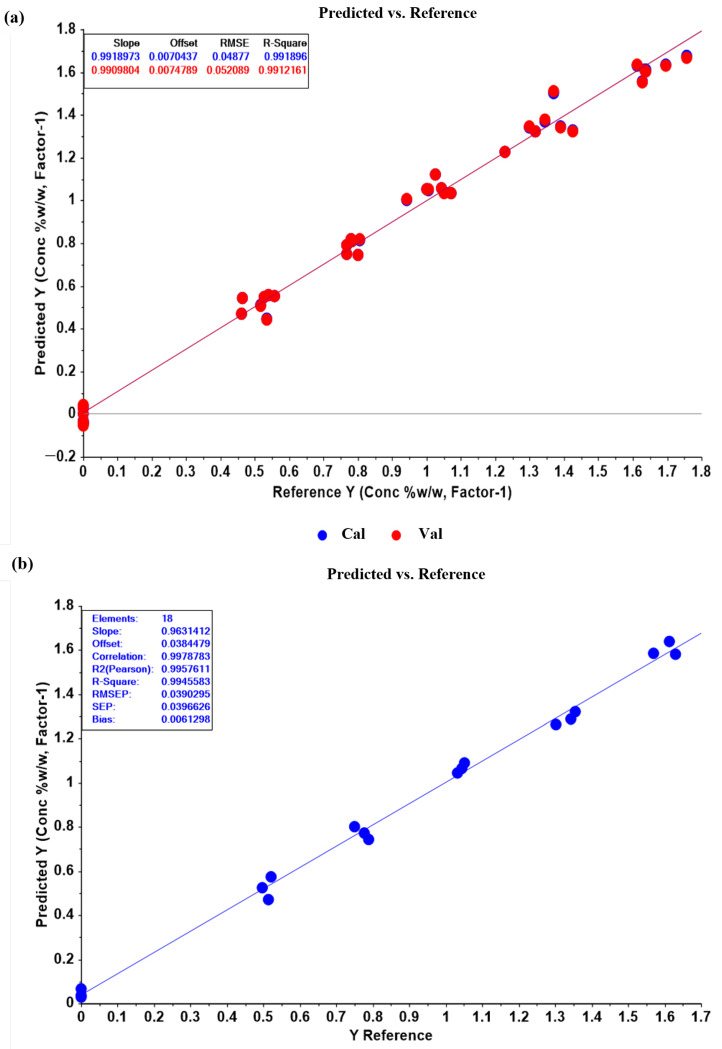
Figure 5.
(a) Plot of the partial least-squares regression (PLSR) calibration model of orthogonal signal correction (OSC) pretreated data. The model showed consistency in calibration and cross-validation plots (blue line and red line). Slope, offset (intercept), root mean square error (RMSE) and R2 of the two lines were close to each other, indicating the accuracy of the model. (b) Plot of prediction results obtained from the PLSR model of OSC pretreated data. The prediction plot of miconazole concentrations in the validation set showed a high correlation between the concentrations obtained from the PLSR model (y-axis) and HPLC values (x-axis), with an R2 Pearson of 0.9958 and low error in terms of RMSEP and bias.

