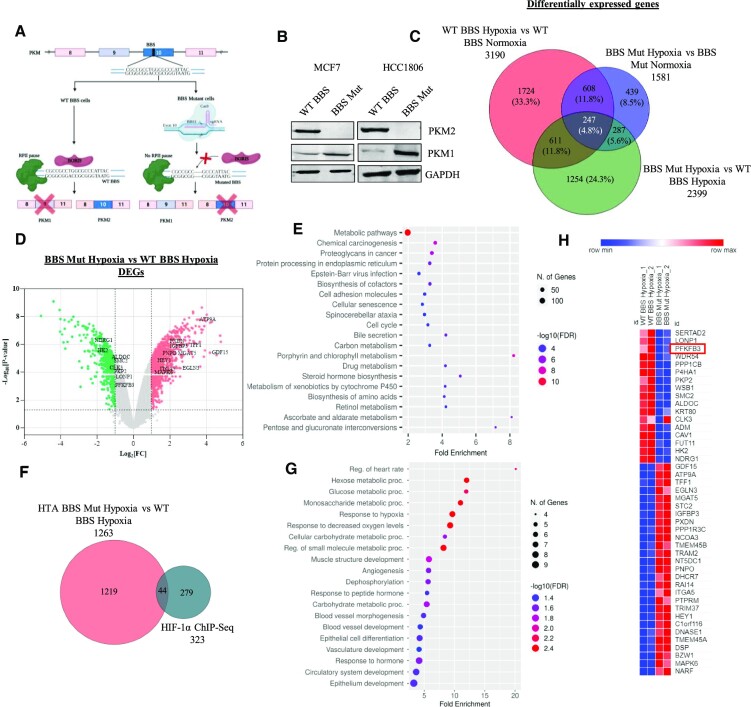
Figure 1.
Nuclear PKM2 affects transcriptome of hypoxic breast cancer cells. (A) Schematic representation of strategy employed for generating CRISPR/Cas9-mediated PKM2 knockout cell lines. (B) Immunoblot analysis of PKM2 and PKM1 in WT BBS and BBS Mut cell lines of MCF7 and HCC1806. (C) Venn diagram depicting the DEGs under the conditions of WT BBS MCF7 hypoxia vs. normoxia, BBS Mut MCF7 hypoxia versus normoxia, and BBS Mut MCF7 hypoxia versus WT BBS MCF7 hypoxia. (D) Volcano plot of HTA 2.0 analysis showing the DEGs in BBS Mut MCF7 hypoxia versus WT BBS MCF7 hypoxia. The significantly downregulated and upregulated genes are indicated with green and red points respectively (P < 0.05 and Fold Change > 2). The top targets have been highlighted. (E) Dot plot representing top 20 enriched terms for biological processes for the DEGs obtained from BBS Mut hypoxia vs WT BBS hypoxia HTA 2.0 analysis. (F) Venn diagram depicting the common genes between HIF-1α ChIP-seq and BBS Mut hypoxia vs. WT BBS hypoxia HTA 2.0 analysis. A total of 44 HIF-1α target genes were differentially expressed due to absence of PKM2. (G) Dot plot representing the top 20 enriched terms for GO Biological Process (FDR < 0.05) in the common genes identified from HIF-1α ChIP-Seq and DEGs from BBS Mut hypoxia vs WT BBS hypoxia HTA 2.0 analysis. (H) Heat map representation of 44 common genes from HIF-1α ChIP-Seq and DEGs from BBS Mut MCF7 hypoxia vs. WT BBS MCF7 hypoxia microarray analysis. For figure (B) representative images are provided. Error bars show mean values ± SD (n = 3 unless otherwise specified).

