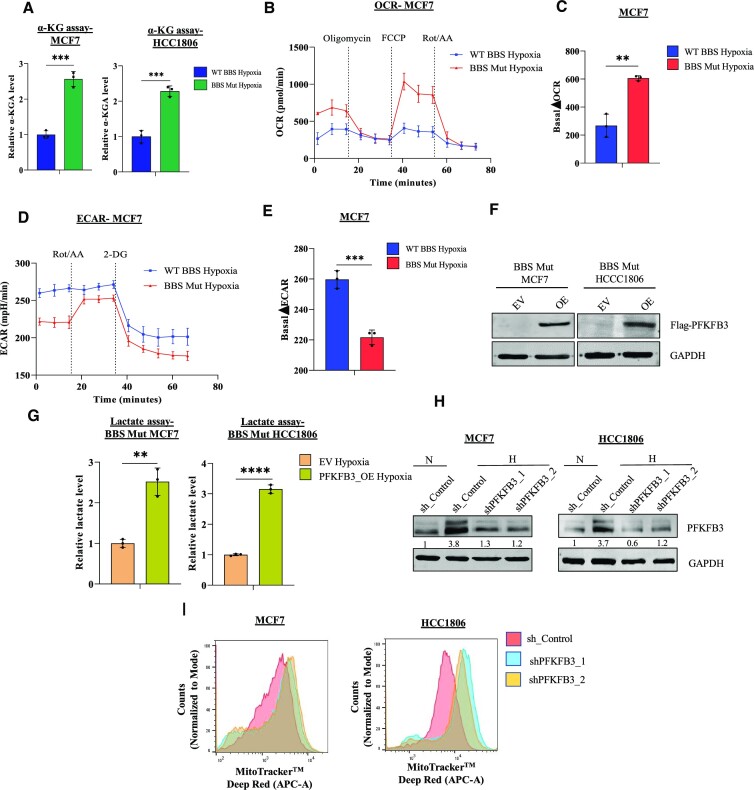
Figure 6.
Abrogating PFKFB3 expression enhances OXPHOS dependency under hypoxia. (A) α-KGA assay indicating elevated α-KGA levels in the BBS Mut cell lines of MCF7 and HCC1806 under hypoxia. (B) Real-time analysis of the OCR in the hypoxic WT BBS and BBS Mut MCF7 cells. (C) Quantification of the basal ΔOCR in hypoxic WT BBS and BBS Mut MCF7 cells. (D) Real-time analysis of the ECAR in WT BBS and BBS Mut MCF7 cells under hypoxia. (E) Quantification of the basal ΔECAR in hypoxic WT BBS and BBS Mut MCF7 cells. (F) Immunoblot analysis depicting PFKFB3 overexpression in BBS Mut cell lines. (G) Intracellular lactate production upon PFKFB3 overexpression in the BBS Mut cell lines estimated by lactate assay. (H) Immunoblot analysis of PFKFB3 knockdown performed in the WT BBS cell lines under hypoxia. (I) MitoTracker FACS analysis depicting an increased ΔΨ of PFKFB3 knockdown WT BBS MCF7 and HCC1806 cells. For figures (F), (H) and (I), representative images are provided. Error bars show mean values ± SD (n = 3 unless otherwise specified). As calculated using two-tailed Student's t-test, *P ≤ 0.05, **P ≤ 0.01, ***P ≤ 0.001, ****P ≤ 0.0001.

