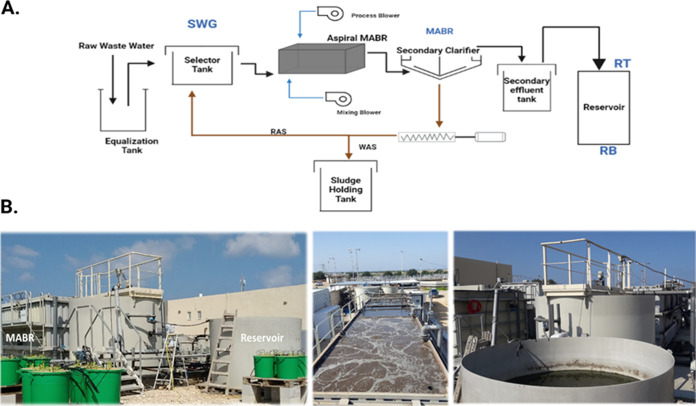
FIG 1.
Overview of the experimental beta-site. (A) Schematic diagram of the raw-sewage–MABR–reservoir continuum at the beta site. Sampling points include SWG (raw sewage), MABR, RT (reservoir top; faucet situated at the top 10 cm of the reservoir), and RB (reservoir bottom; faucet situated at the bottom 10 cm of the reservoir). (B) Profile (left) and aerial photos of the MABR (middle) and reservoir (right) at the beta site.

