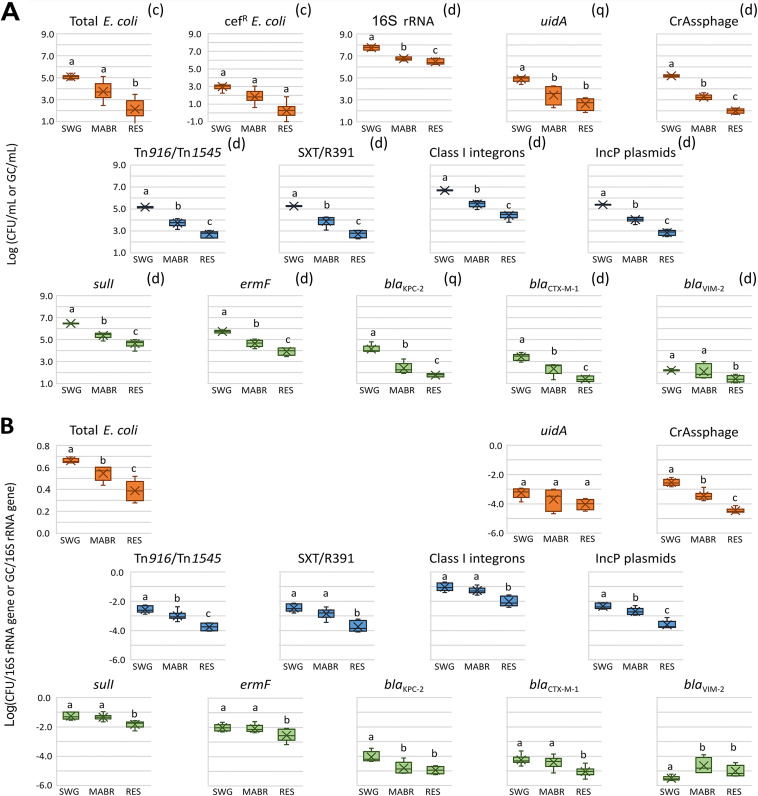
FIG 3.
Absolute (A) and relative (B) abundances of total and cefotaxime-resistant E. coli and of 12 ARG/MGE markers in the sewage, MABR, and reservoir. Each data point represents aggregated data collected from six different sampling times and four biological replicates. One-way ANOVA followed by pairwise two sample t test highlights significant differences. Box colors represent MGE (blue), ARG (green), and bacterial and CrAssphage (orange) indicators. Superscripts above each graph in panel A indicate culture (c)-, qPCR (q)-, and ddPCR (d)-based analyses. The boxes indicate the range between the first and third quartile. The top and bottom whiskers of the boxes represent maximum and the minimum values, respectively. The median line divides the box into interquartile ranges, and the cross represents the mean. Each box represents the spread of time point averages (four biological replicates per time point). Swg, raw sewage; Res, reservoir.

