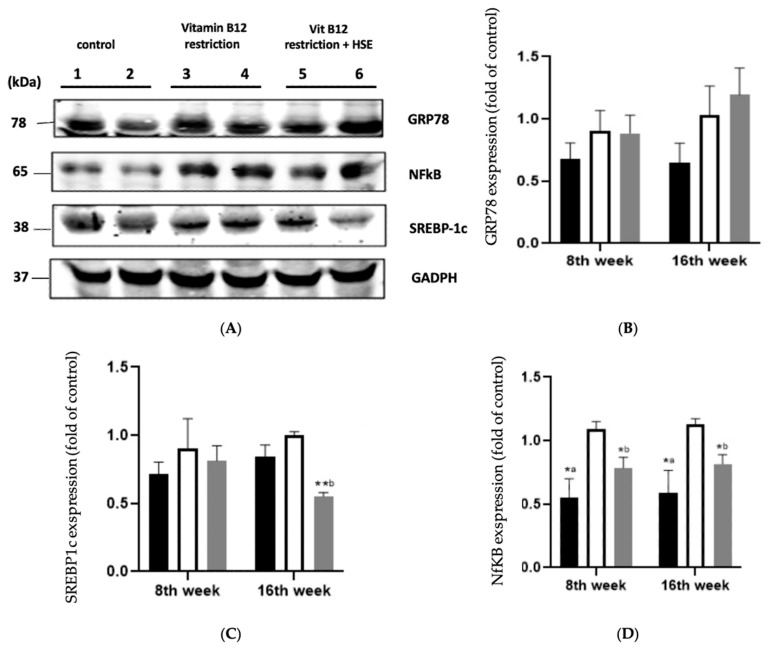
Figure 2.
Western blot analysis of GRP78, NFkB and SREBP1c in the rat liver tissue. (A) GRP78, NFkB and SREBP1c protein bands in the liver tissue of the control group after 8 weeks (1) and 16 weeks (2); the restriction group after 8 weeks (3) and 16 weeks (4); and the treatment group after 8 weeks (5) and 16 weeks (6). The control group was given a normal diet without HSE, the restriction group was given a vitamin B12-restricted diet without HSE, and the treatment group was given a vitamin B12-restricted diet and HSE at 400 mg/kg weight/day. GADPH was used as an internal control. (B) GRP78-relative protein quantification analysis; (C) NFkB analysis relative to protein quantification; and (D) SREBP1c-relative protein quantification analysis. Bars represent different treatment ages for each group of experimental animals. HSE = Hibiscus sabdariffa ethanol extract, GRP78 = glucose-regulated protein-78, NFkB = nuclear factor kappa B, SREBP-1c = sterol regulatory element-binding protein 1c, GADPH = glyceraldehyde 3-phosphate dehydrogenase. Black box: control group; white box: Vit.B12 restriction group; grey box: Vit B12 restriction + HSE. Data are presented as the mean ± SD. Mean differences were calculated by one-way ANOVA followed by Tukey’s post hoc test. The mean difference was significant between control group and restriction group (*a p < 0.05) and the treatment group compared to the restriction group (*b p < 0.05, **b p < 0.01).

