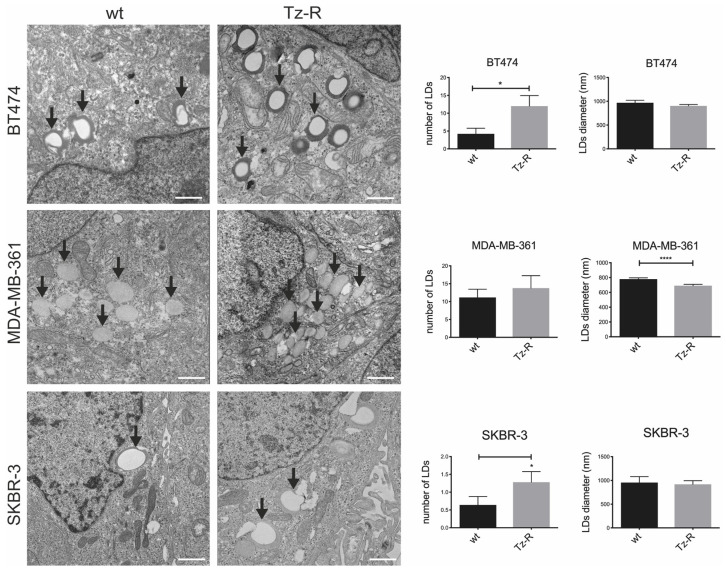
Figure 8.
Representative TEM images of ERBB2+ BCa wt and Tz-R cell lines. Lipid droplets [LDs] were morphologically identified [black arrows]. Bar plots show the LD number and diameter measured for each experimental condition. For this analysis, 10 whole cells were scored and measured for LDs with Radius 2.0 imaging software. p = 0.023 [*] for SKBR-3, p = 0.032 [*] for BT474 [LDs number] and p < 0.0001 [****] for MDA-MB-361 [LDs diameter], respectively. Scale bars: 1 µm.

