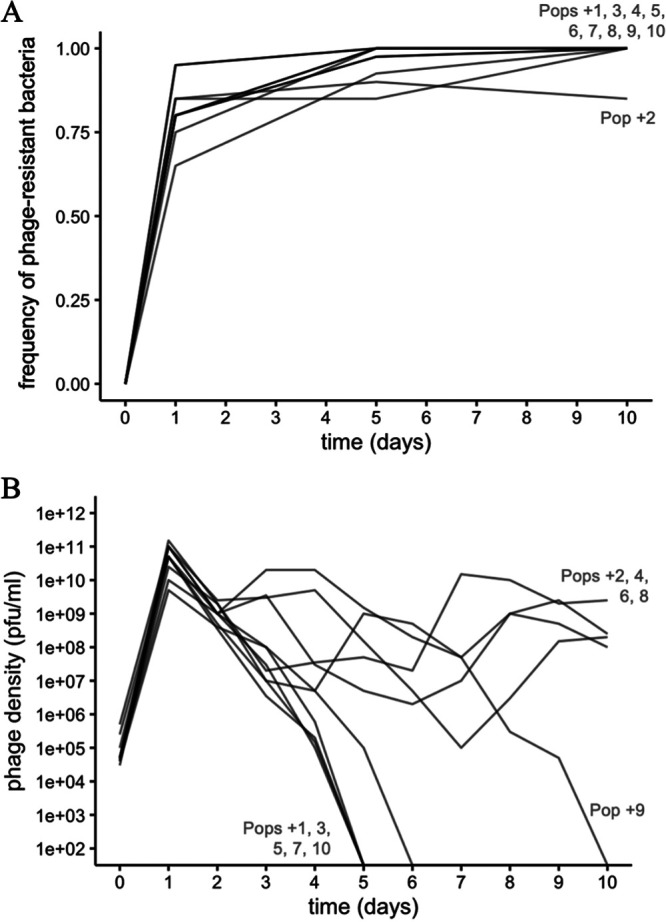
FIG 2.

Dynamics during the 10-day evolution experiment. (A) Host bacteria rapidly evolve high levels of resistance to phage U136B within 1 day of the experiment. By day 10, most populations have undetectable levels of phage susceptibility. Each time point represents the testing of 20 (days 1 and 10) or 40 (day 5) bacterial isolates per population for a total of 800 tests across the experiment. The limit of detection for sensitive bacteria is 95% (days 1 and 10) and 97.5% (say 5). (B) Phage population dynamics. Phage densities were measured on each day during the evolution experiment, with a limit of detection of approximately 100 PFU/mL on the ancestral bacteria. Lines represent the 10 independently evolved populations.
