FIG 3.
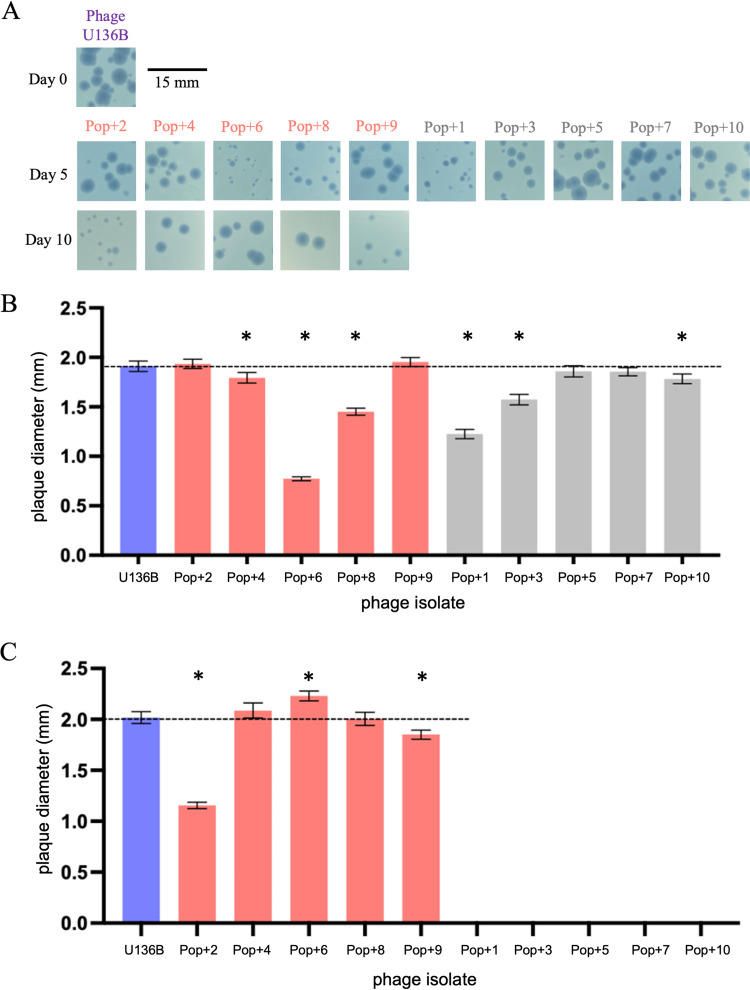
Evolution of phage U136B plaque size during serial passaging with E. coli. (A) Evolved phage isolates were obtained from each of 10 evolved host-phage communities and plated on ancestral bacteria, revealing variation in plaque size among populations. Representative plaques are shown in the photos, and hundreds of plaques (range 357 to 1354) were analyzed using Image J for the quantitative results in panels B and C. (B) On day 5, six evolved phage isolates had significantly reduced plaque sizes compared to the ancestral U136B phage (Pop+4, Pop+6, Pop+8, Pop+1, Pop+3, and Pop+10). Pink bars indicate survival-bound populations and gray bars indicate extinction-bound populations. Error bars indicate 95% CIs, and asterisks indicate significantly different means based on unpaired two-tailed t tests between each isolate and the ancestral phage U136B after Holm-Bonferroni correction (P values are listed in the main text). (C) On day 10, plaque size was significantly smaller for isolates from Pop+2 and Pop+9 and significantly larger for Pop+6. Phage isolate details are listed in Table 1. Statistical analysis was performed and reported as in panel B.

