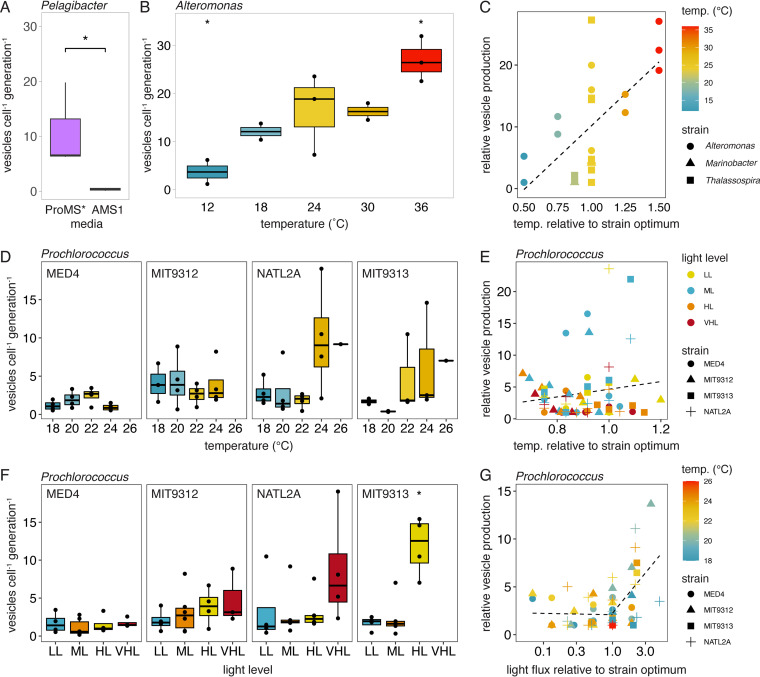
FIG 2.
Vesicle production rate variation with changes in environmental factors. (A) Pelagibacter vesicle production in two different media. (B) Vesicle release across growth temperatures in Alteromonas. (C) Relative changes in vesicle release rates across three different marine heterotrophs, relative to their strain-specific growth optima. (D) Vesicle production rates from four Prochlorococcus strains with changes in the growth temperature. (E) Relative vesicle production rates by Prochlorococcus strains, compared to the temperature that maximized the growth rate for each strain and light level (optimal = 1). (F) Vesicle production rates from four Prochlorococcus strains with changes in light irradiance. LL, low light; ML, medium light; HL, high light; VHL, very high light (Table S1). (G) Relative Prochlorococcus vesicle production rates as a function of the light level. Vesicle release is normalized, relative to the minimum measured value for each strain. The light levels are compared to the irradiance that resulted in the maximal growth rate for each strain (optimal = 1). The dashed line in panel C indicates the linear regression fit. The lines in panels E and G represent the change point regression fit. *, P < 0.05; Wilcoxon test for panels A and F; t test in panel B.

