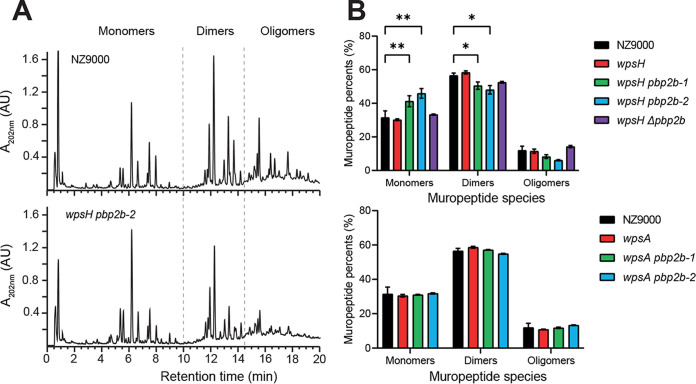
FIG 6.
PG analysis of L. cremoris NZ9000, wpsH and wpsA mutants, and their respective pbp2b derivatives. (A) Representative muropeptide profiles obtained after PG digestion with mutanolysin and separation by RP-UHPLC for NZ9000 and wpsH pbp2b-2 strains. Identification of peaks containing monomers, dimers, or oligomers is based on mass spectrometry analysis and previous muropeptide identification (39). Monomers correspond to disaccharide peptides, dimers to two cross-linked monomers, and oligomers to three or more cross-linked monomers. (B) Relative abundances (%) of different muropeptide species for NZ9000, the wpsH mutant and its pbp2b derivatives (upper panel), and the wpsA mutant and its pbp2b derivatives (lower panel). Each value is the mean of three biological replicates. Errors bars represent ± the standard deviations of the mean. Abundance of each muropeptide species in mutant strains was compared to that of WT using a two-way analysis of variance, followed by Dunnett’s multiple comparison with a 95% confidence interval. The P values of significant differences are indicated by asterisks (*, P < 0.05; **, P < 0.01).

