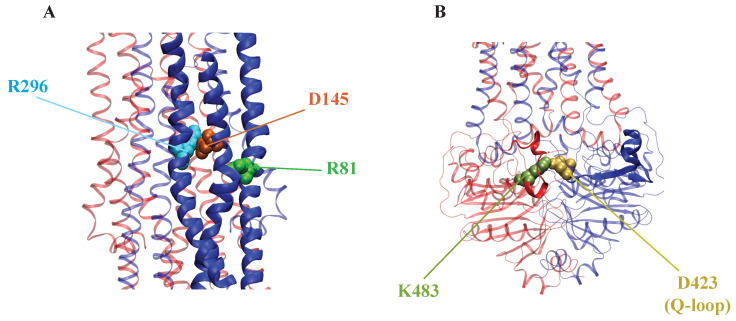
Figure 7.
The cartoon representation of Sav1866 (PDB ID: 2HYD) shows the salt bridge interactions in different parts of the protein. Different colors indicate the different amino acids involved in the salt bridge interactions. (A) The salt bridge interaction between R81 and D145 of two helices (TM2 and TM3) in the same monomer. This figure also shows salt bridge interaction between R296 and D145 (TM6 and TM3 of the same monomer). (B) The salt bridge interaction between D423 and K483 is located in the Q-loop and region beside the signature sequence, respectively.

