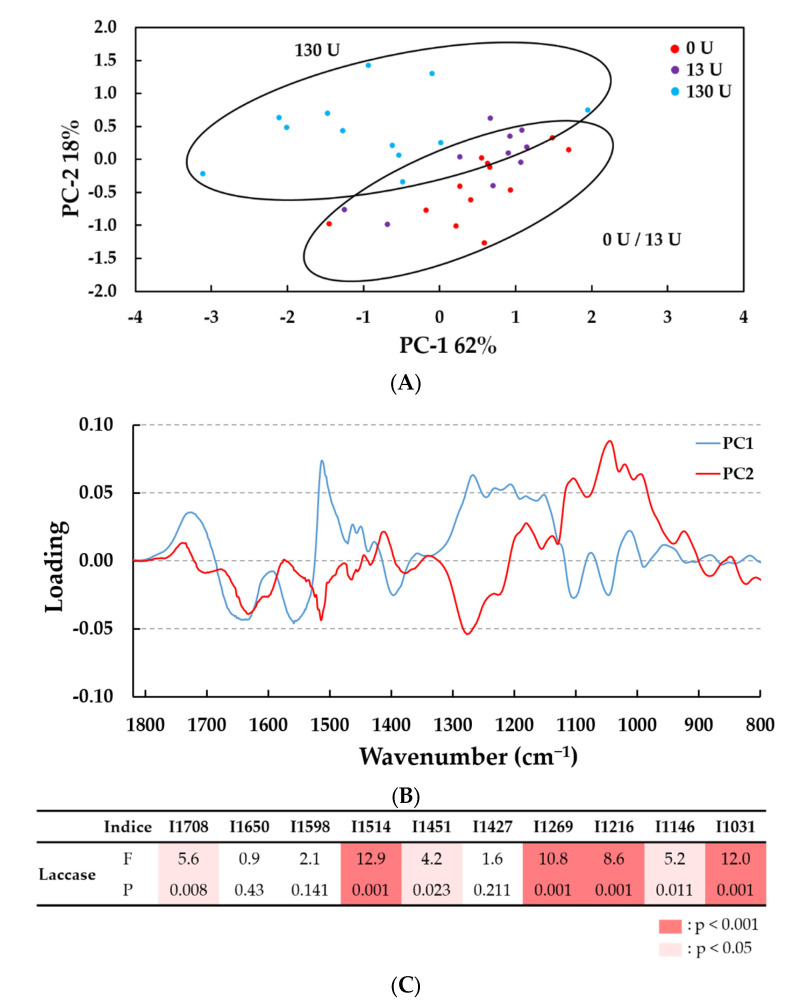
Figure 5.
PCA analysis of the FTIR spectra in the 1800–700 cm−1 wavenumber range. (A) Score plot of PC2 (18%) vs. PC1 (62%); (B) loadings profile highlighting the bands that contributed most to the separation of lignin samples (n = 34 samples). (C) Results of one-way ANOVA on ten bands identified on the loadings profile. Laccase activated lignins at pH 4.5 with 0, 13 and 130 U/g lignin, with and without HBT, treated for 0, 0.5 and 2 h. Differences between concentration levels of enzymatic treatment are significant at F statistic > 1 and p < 0.001 (in red) or p < 0.05 (in pink). The F test statistic is the ratio of two variances (variance between groups on variance within groups) and the p value is the probability that determine if the difference between group means is statistically significant at 99.9% or 95%.

