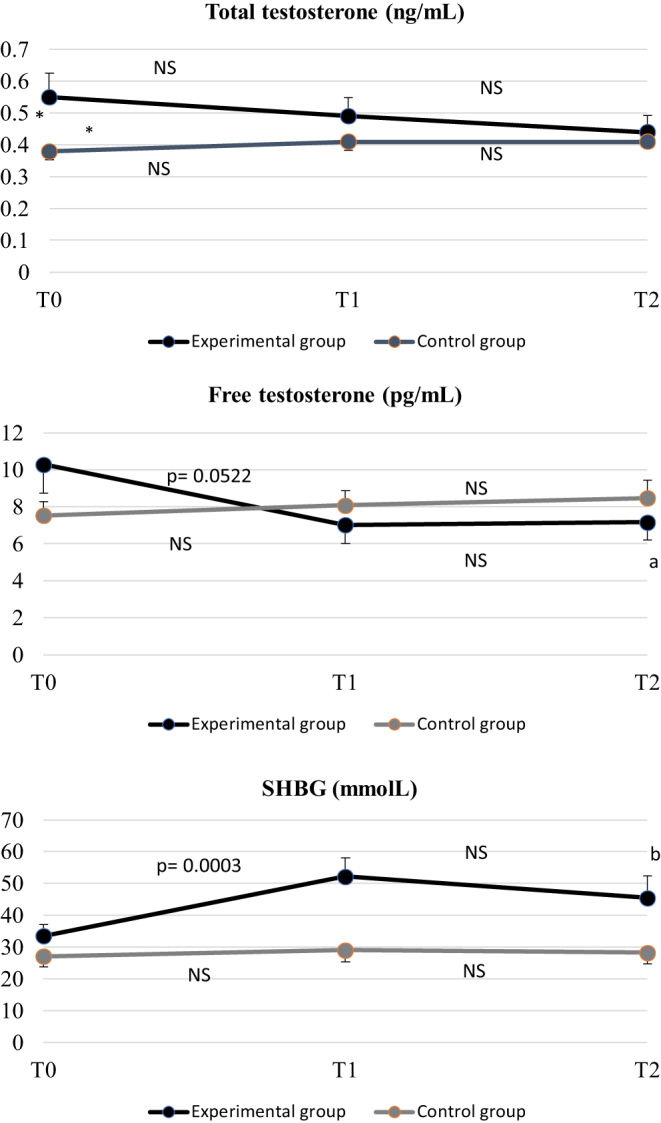
Figure 2.

Total and free testosterone and SHBG at baseline (T0), 8 weeks (T1), and 16 weeks (T2) of the study in the experimental and control groups. Free testosterone was calculated by Vermeulen method. Data are expressed as mean and s.e.m.. *P = 0.0491 in the comparison between the two groups at baseline, and aP = 0.0234 and bP = 0.0036 in the comparison between T0 and T2 within the experimental group by ANOVA (no statistical differences were observed between T0 and T2 within the control group). P values shown in the figures represent the comparison between T0 and T1 and T1 and T2 within each group by ANOVA. The overall modification of free testosterone and SHBG during the study, estimated by the GLM, was significant only in the experimental group (P = 0.035 and P < 0.0001, respectively). Moreover, the overall modification of free testosterone and SHBG in the experimental group was significantly different with respect to the overall modification in the control group (P = 0.0009 and P = 0.0004, respectively).

 This work is licensed under a