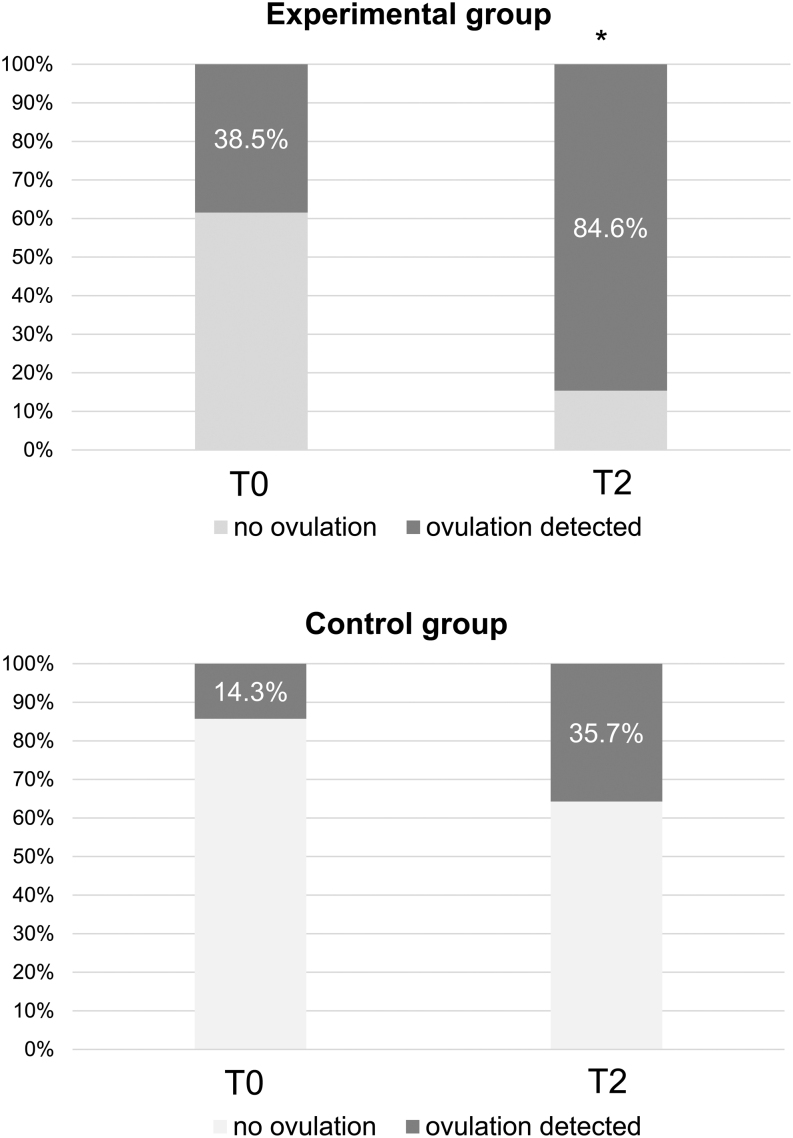
Figure 3.
Percentage of ovulation at baseline (T0) and 16 weeks (T2) of the study in the experimental and control groups. No statistical difference was observed between the two groups at baseline, but at the end of the study, it was significantly different between the two groups (P = 0.018) (χ2 test). *P = 0.031 by McNemar's test in the comparison between T0 and T2 within the experimental group. The comparison between T0 and T2 within the control group was not significant.

 This work is licensed under a