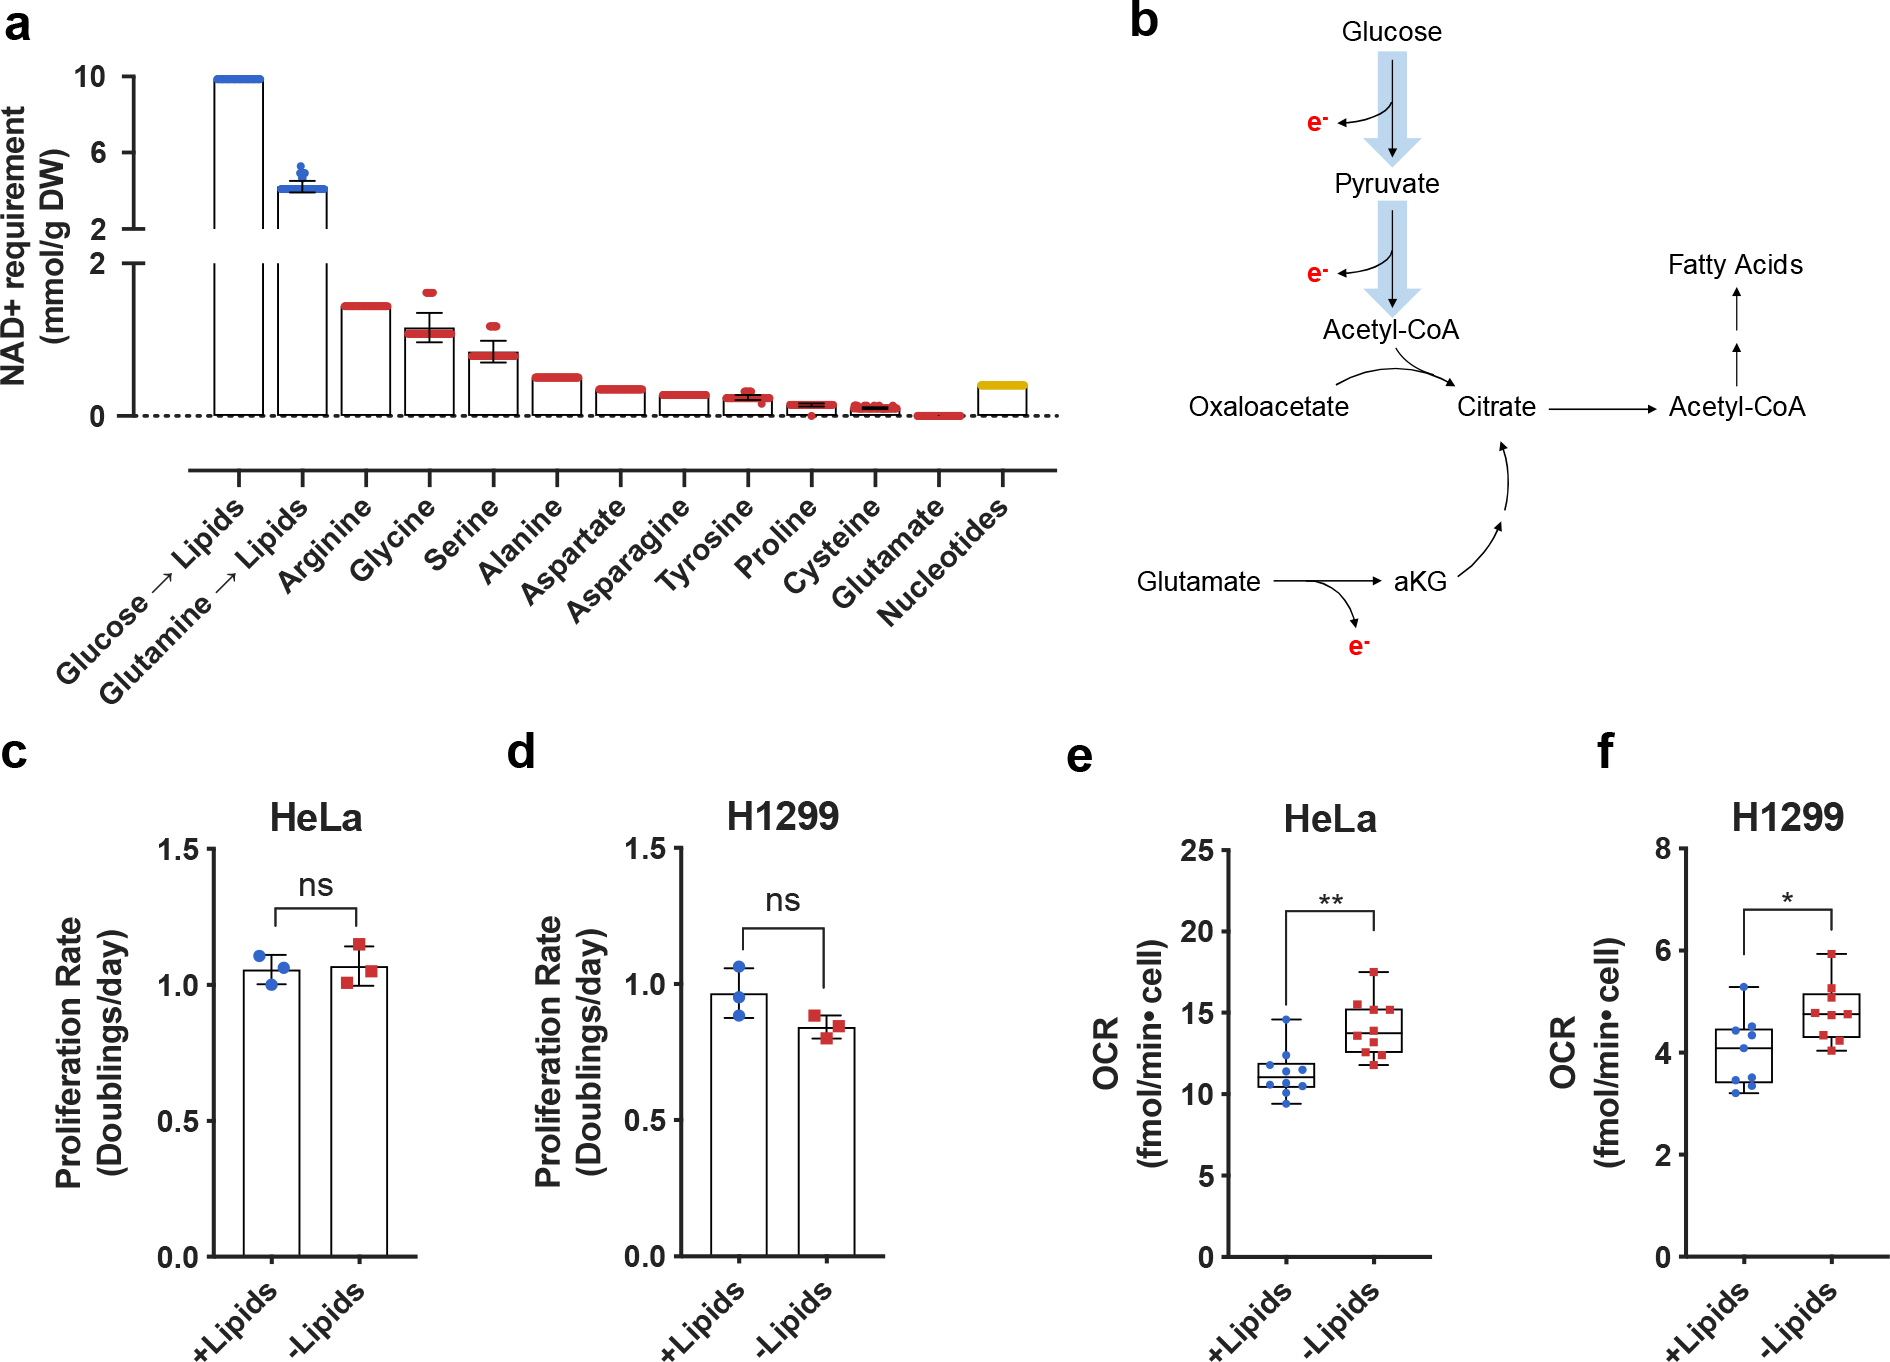
Fig. 1 |. Increased lipid synthesis results in increased oxygen consumption and is predicted to increase cellular demand for NAD+.

a, Quantitative predictions for the NAD+ consumption cost of de novo synthesis of biomass components lipids (blue), nonessential amino acids (red), and nucleotides (yellow) based on metabolic flux modelling. The NAD+ consumption cost is shown separately for synthesis of lipids via oxidative glucose metabolism (Glucose → Lipids) and reductive glutamine metabolism (Glutamine → Lipids). Error bars denote the standard deviations of costs calculated across models of NCI-60 cancer cell lines. Each individual value denotes a single cell line prediction from the NCI-60 panel. B, Schematic showing routes of citrate production and their associated requirements for electron (e−) disposal. Reactions requiring e− disposal either directly or indirectly require NAD+ as an e− acceptor. c, Cell culture media was prepared with delipidated serum, and then reconstituted with 1% Lipid Mixture (2 μg/ml arachidonic and 10 μg/ml each linoleic, linolenic, myristic, oleic, palmitic and stearic acid, and 0.22 mg/ml cholesterol) (+lipids) or vehicle (−lipids). Proliferation rate of HeLa cells cultured in media +lipids or −lipids as indicated (n=3 per condition from a representative experiment). d, Proliferation rate of H1299 cells cultured in media +lipids or −lipids as indicated (n=3 per condition from a representative experiment). e, Mitochondrial oxygen consumption rate (OCR) of HeLa cells cultured in media +lipids or −lipids as indicated (n=10 per condition from a representative experiment). f, Mitochondrial OCR of H1299 cells cultured in media +lipids or −lipids as indicated (n=10 per condition from a representative experiment). All data represent mean ± s.d. *P < 0.05, **P < 0.01, ns P > 0.05, unpaired Student’s t-test. All experiments were repeated 3 or more times.
