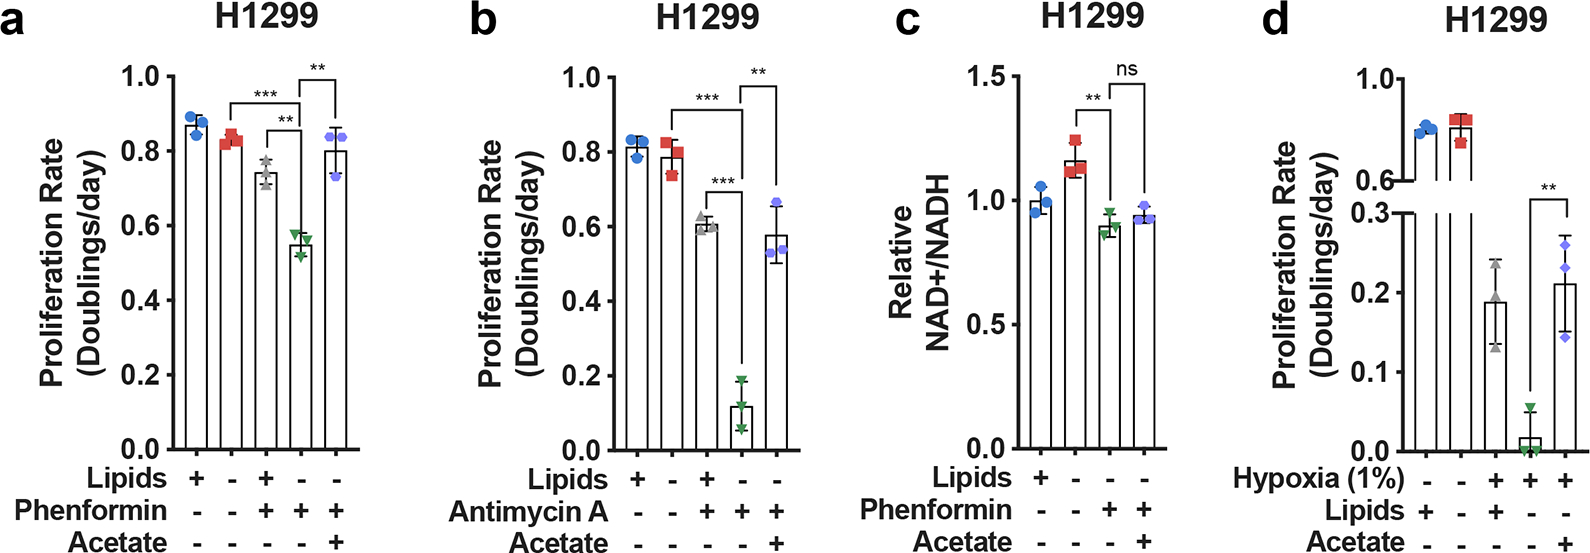
Extended Data Fig. 7 |. Bypassing oxidative steps in fatty acid synthesis rescues proliferation in electron acceptor deficient cells.

a, Proliferation rates of H1299 cells cultured in media +lipids or −lipids without or with phenformin (10μM) and/or acetate (200 μM) as indicated (n=3 per condition from a representative experiment). b, Proliferation rates of H1299 cells cultured in media +lipids or −lipids without or with antimycin A (15nM) and/or acetate (200 μM) as indicated (n=3 per condition from a representative experiment). c, Relative NAD+/NADH ratio in H1299 cells cultured in media +lipids or −lipids without or with phenformin (10μM) and/or acetate (200 μM) as indicated (n=3 per condition from a representative experiment). d, Proliferation rates of H1299 cells cultured in media +lipids or −lipids in normoxia (21% oxygen), hypoxia (1% oxygen), and/or acetate (200 μM) as indicated. Data from the first four conditions are the same as those presented in Extended Data Fig. 2a. (n=3 per condition from a representative experiment). e, NADP+/NADPH ratio in HeLa cells cultured in media +lipids or −lipids in hypoxia (1% oxygen) or phenformin (100 μM) with pyruvate (1mM), lactate (10mM), or acetate (200μM) added, as indicated. Ratios of NADP+/NADPH were normalized to normoxia samples or vehicle treated samples (n=3 per condition from a representative experiment). All data represent mean ± s.d. **P < 0.01, ***P < 0.001, ns P > 0.05, unpaired Student’s t-test. All experiments were repeated 3 times or more.
