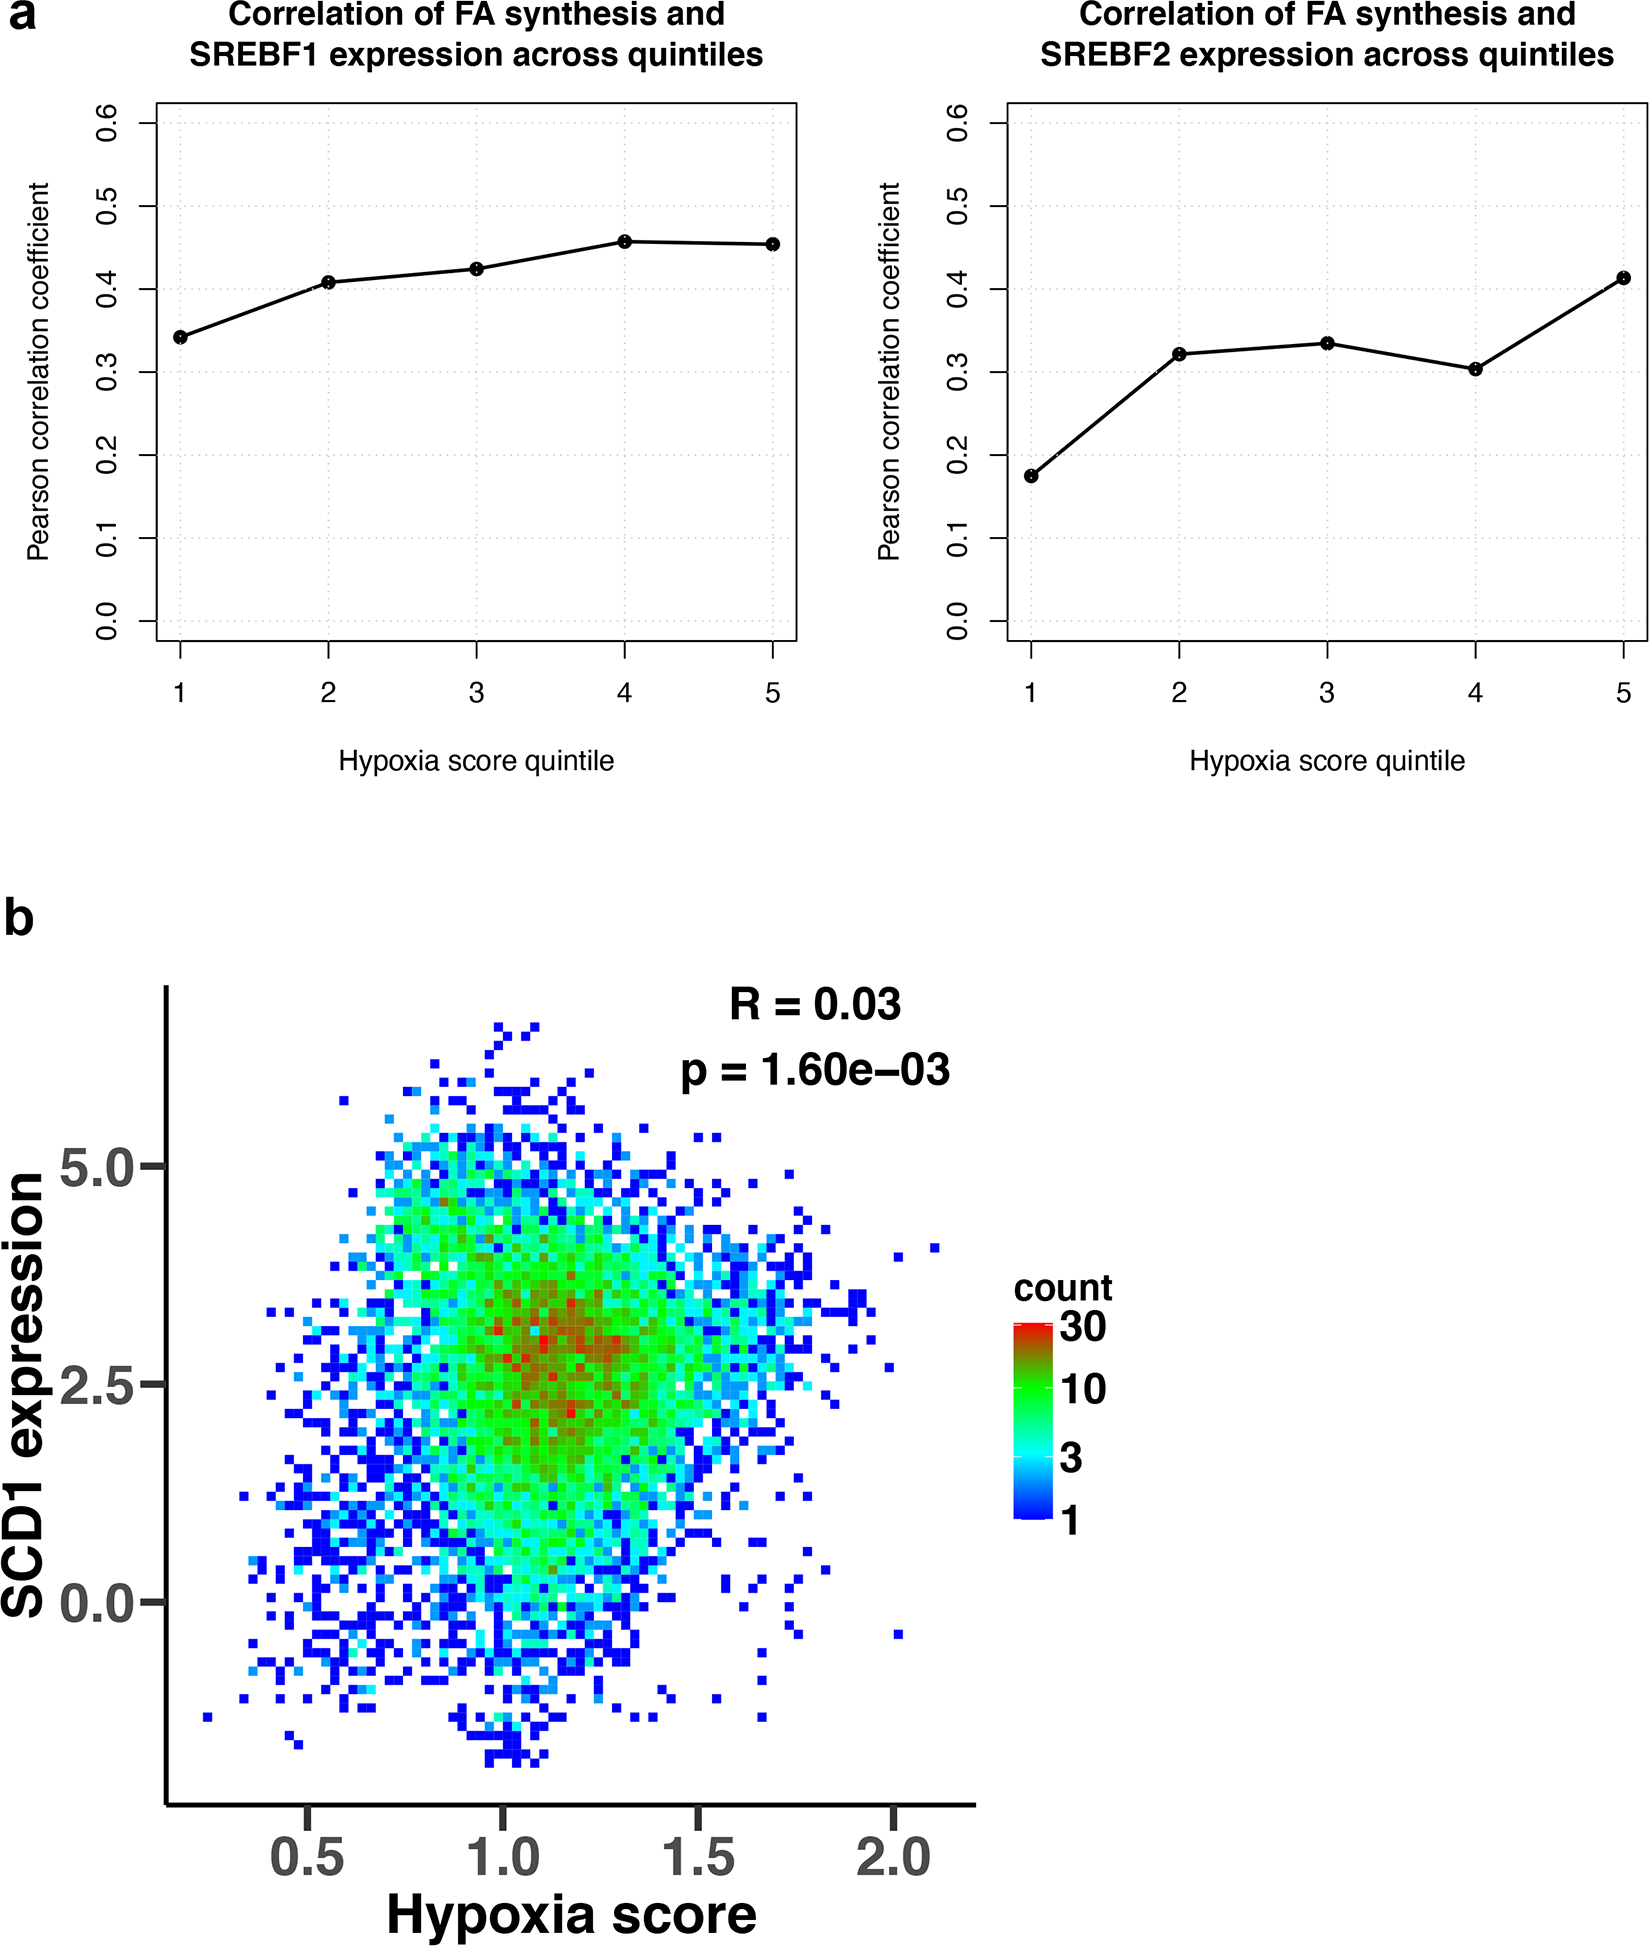
Extended Data Fig. 10 |. Gene expression correlations between lipid metabolism genes and hypoxia signature genes.

a, Correlation of mRNA expression of SREBF1/2 and of gene markers of fatty acid synthesis within individual hypoxia score quintiles. Pearson’s correlation coefficients were calculated for each of five equally-sized bins of TCGA samples, corresponding to five hypoxia score quintiles, for SREBF1 (left) and SREBF2 (right). TCGA samples were sorted into quintiles based on their hypoxia scores from the lowest hypoxia score (quintile 1) to the highest score (quintile 5). b, Density plot of the correlation between the average mRNA expression of gene markers of tumor hypoxia and mRNA expression of Stearoyl-CoA desaturase 1 (SCD1) gene. Density counts represent the number of TCGA samples with the corresponding expression values, with red color representing high density regions and blue color representing low density regions, and the Pearson’s correlation coefficient (R) and the p-value are shown in the figure.
