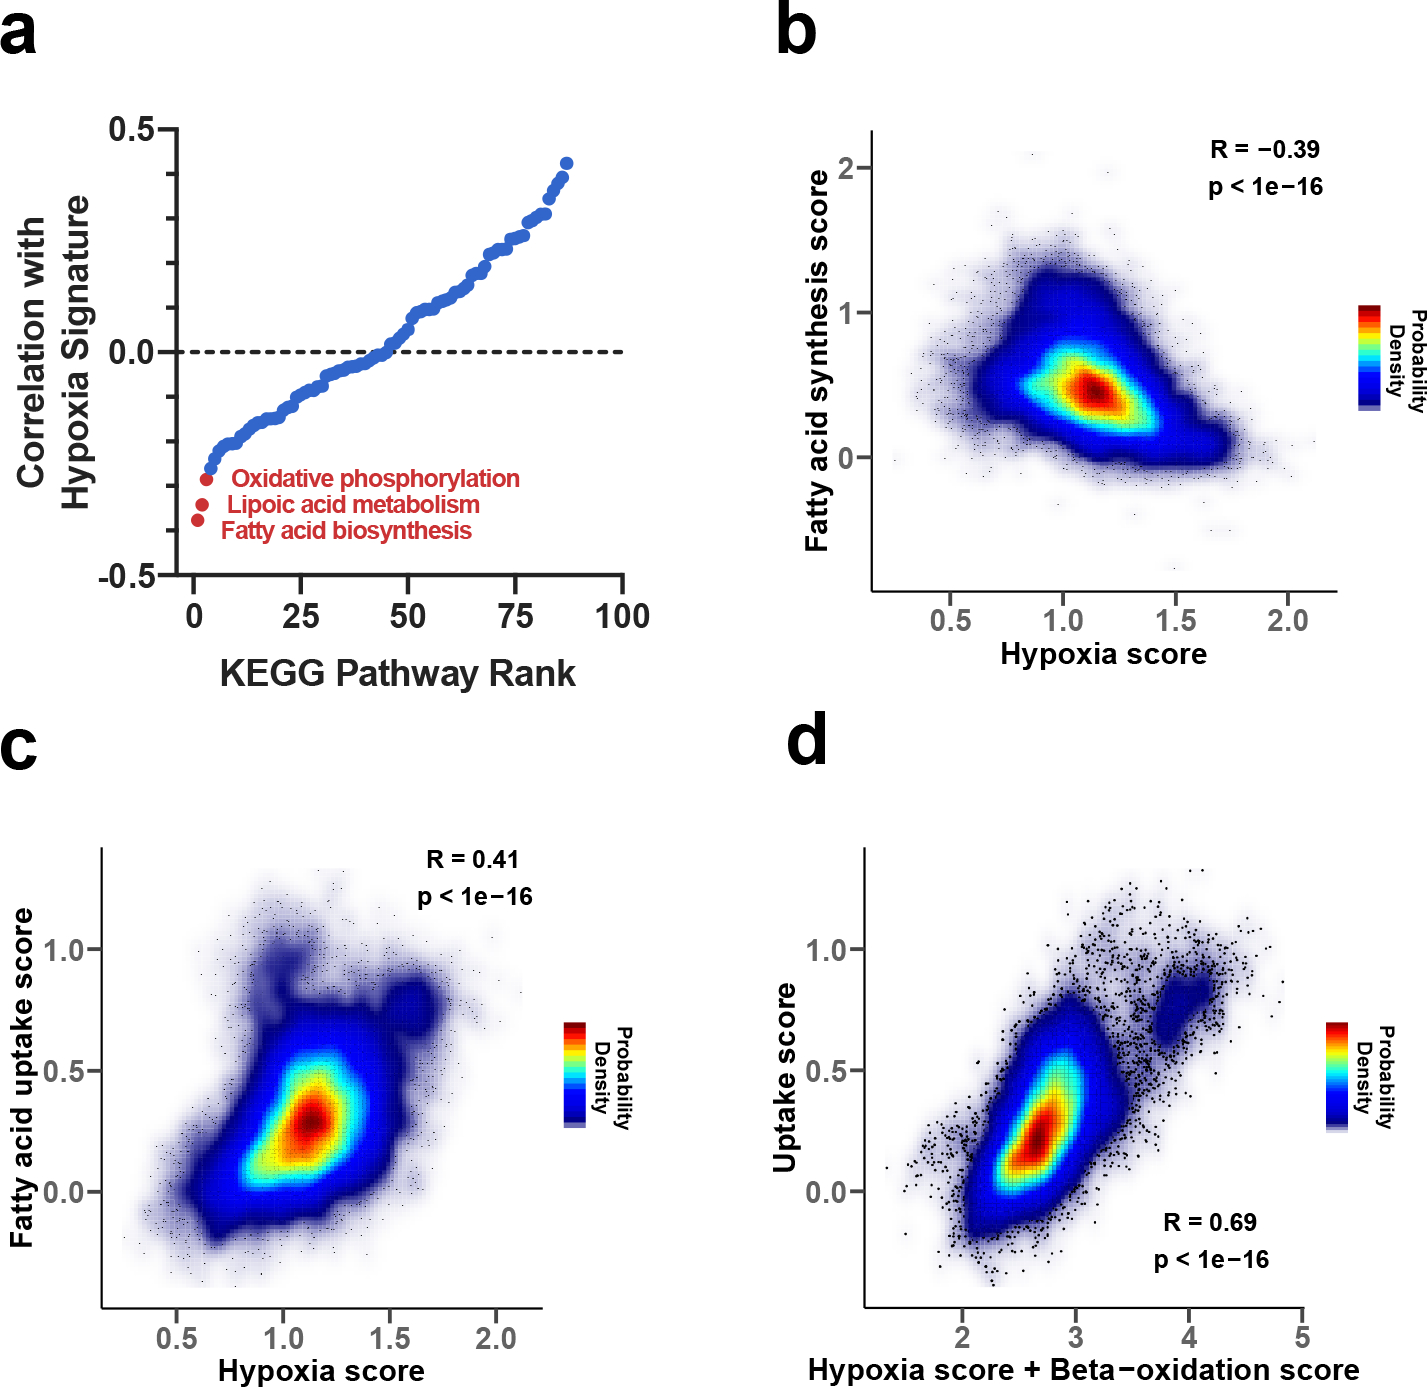
Fig. 6 |. Correlations between mRNA expression of fatty acid synthesis or lipid uptake genes and gene expression markers of tumor hypoxia.

a, Ranking of 87 KEGG metabolic pathways based on the correlation between expression of their genes with expression of known markers of tumor hypoxia (tumor hypoxia scores); the correlations were calculated using TCGA expression data, such that stronger negative correlations correspond to stronger anti-correlations with hypoxia markers. b, Density plot of the correlation between the tumor hypoxia score and expression of genes involved in fatty acid synthesis. c, Density plot of the correlation between the tumor hypoxia score and expression of genes participating in fatty acid uptake. d, Density plot of the correlation between the mRNA expression of gene markers of lipid uptake and the sum of mRNA expression of gene markers of hypoxia and beta-oxidation scores.
