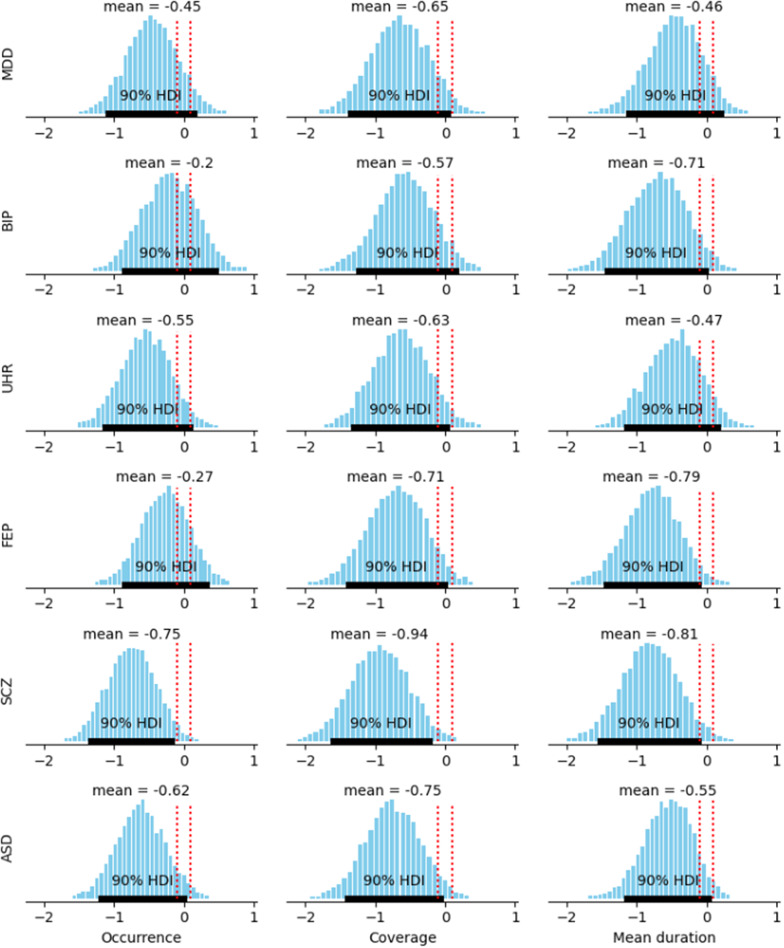
Figure 3.
Posterior estimation of the effect-size of the difference in microstate D parameters (occurrence, coverage, mean duration) between each disease group and the controls. The red dotted interval represents the region of practical equivalence. HDI: 90% highest density interval of the posterior estimation.

