
Figure 3.
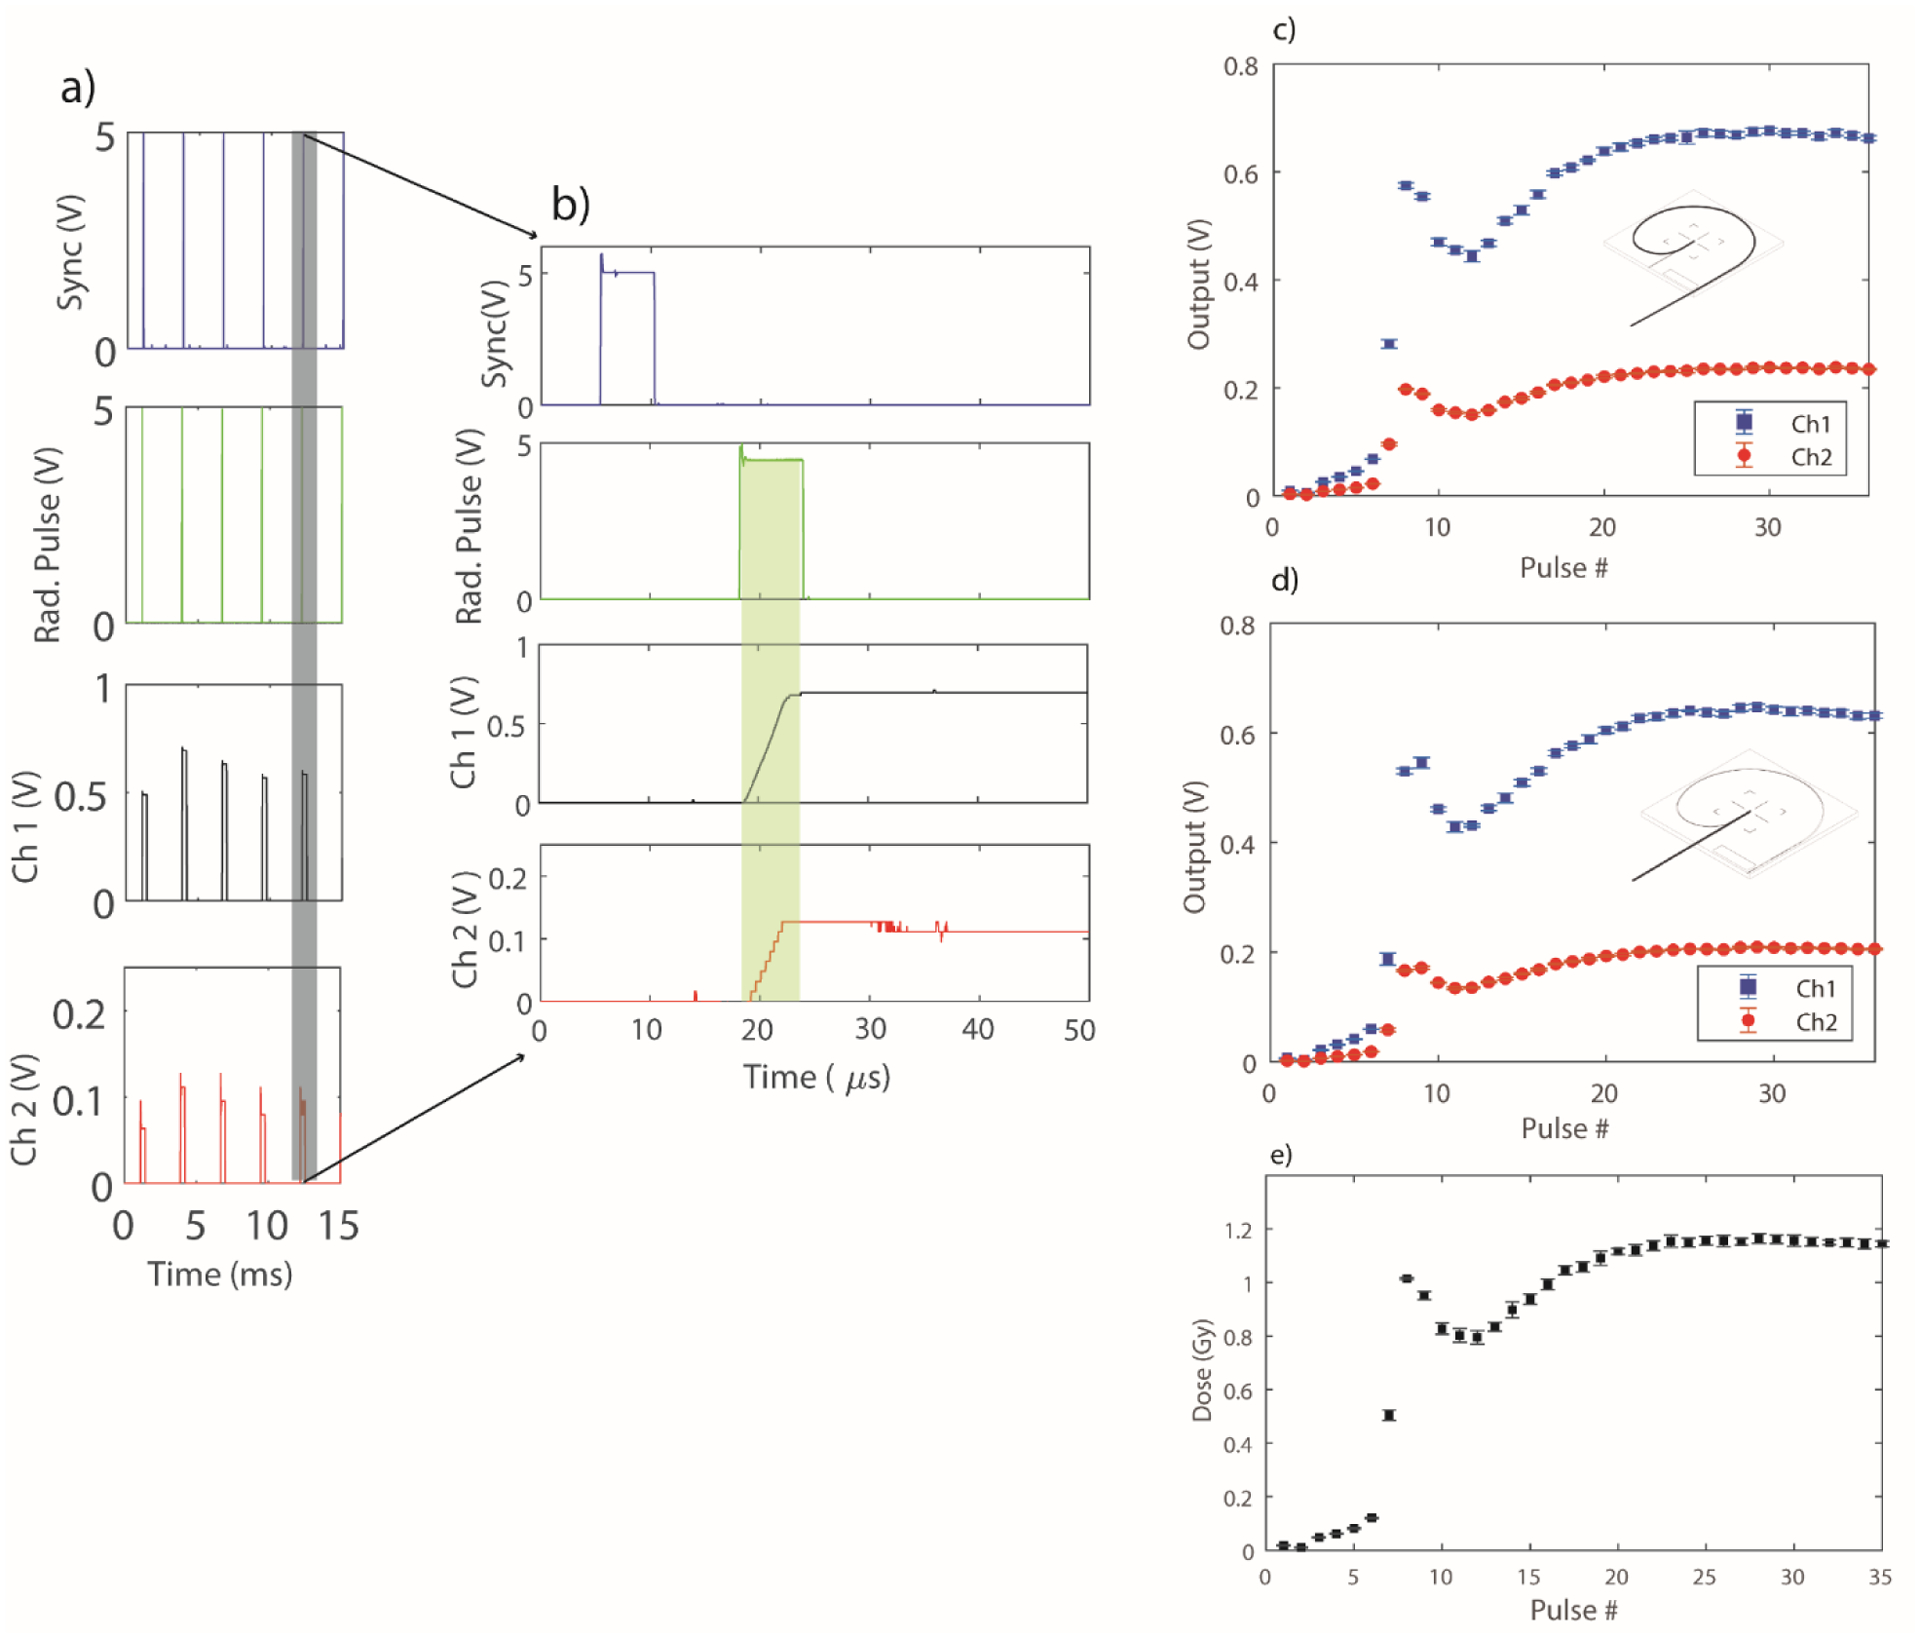
a) Shows a waveform capture of the sync signal, radiation pulse and the integrated two channel output of the photodiode for a sample irradiation. b) Shows a zoomed-in portion of Figure 3a, depicting the dose integration for an individual linac pulse (shaded in green). c, and d) Output from the Exradin-W1 photodiode for the maximum and minimum configuration, respectively. e) Depicts a sample dose delivery of 35 pulses. The error bars for each graph represent the standard deviation obtained from 5 repeated measurements.