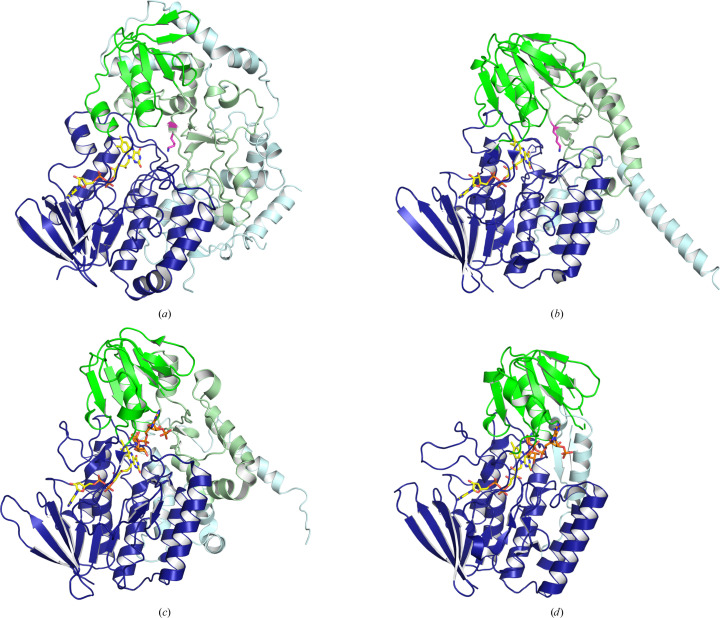
Figure 2.
Domain organization of AetF and structurally related FMOs. The FAD- and NADP-binding domains are shown in dark blue and green, respectively. Additional structural elements inserted into the NADP-binding domain or C-terminally appended to the FAD-binding domain are shown in light green and light blue, respectively. The catalytic lysines of AetF (Lys258) and Bmp5 (Lys277) are shown as stick models with pink C atoms. FAD and NAPD are shown with yellow and orange C atoms, respectively. The domain borders used in this figure are given in Supplementary Table S2. (a) AetF (PDB entry 8cjd). (b) Bmp5 [AlphaFold2 model with FAD from PDB entry 6sek optimized by AlphaFill (Hekkelman et al., 2023 ▸), AF-U6BHD3-F1-model_v4-B-optimized]. (c) AncFMO2 (PDB entry 6sf0). (d) ZvPNO (PDB entry 5nmx).

