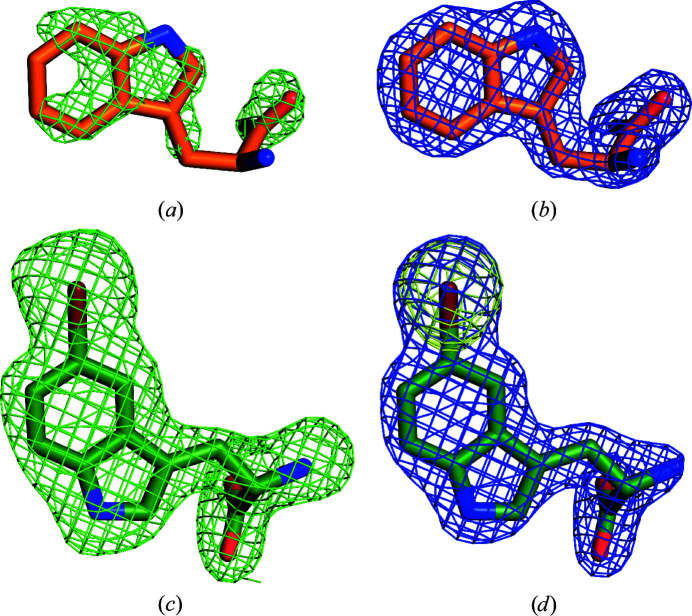
Figure 4.
Electron density of bound substrates. Initial mF o − DF c density before placing the ligand is shown as a green mesh at 3σ and the final 2mF o − DF c density is shown as a blue mesh at 1.5σ. (a, b) Bound Trp from PDB entry 8cje chain C. (c, d) Bound 5-Br-Trp from PDB entry 8cjf chain A. The anomalous signal of bromine in 5-Br-Trp is shown as a yellow mesh (5σ).

