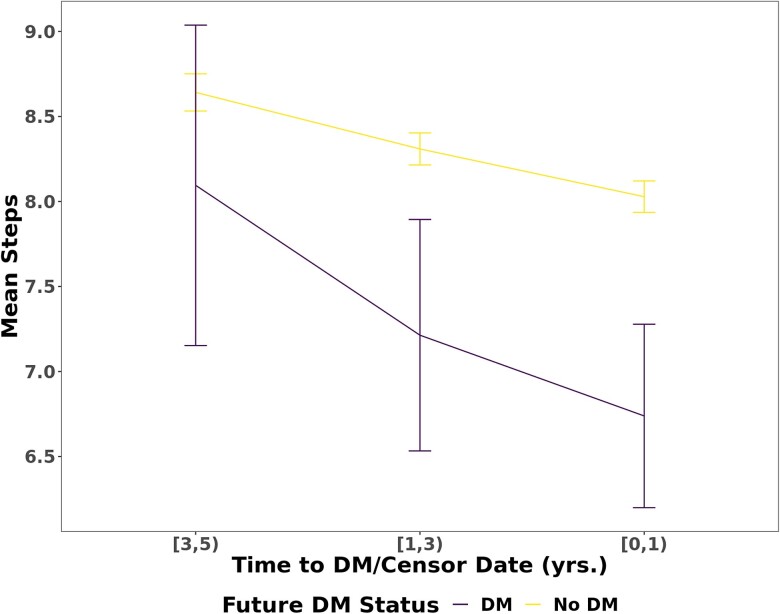
Figure 3.
Mean step count decreased over study period. Trend of mean step count as a function of time to event (incident diabetes or censoring). The x-axis is grouped into ranges of time (ie, [3,5) = a range of 3-5 years prior to event/censoring, which is inclusive of 3.00 and noninclusive of 5.00). Error bars indicate interquartile range. Mean steps is reported in thousands.

