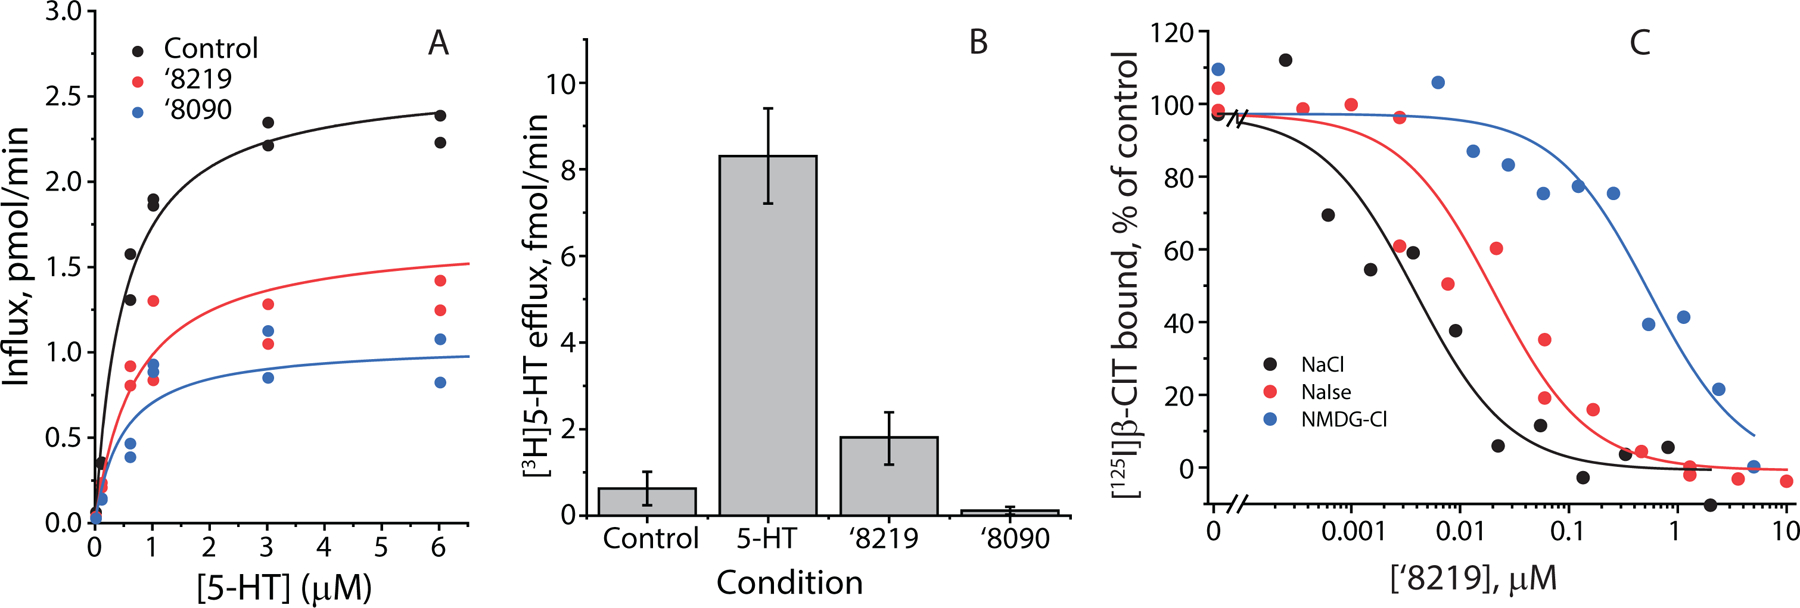
Figure 2.

(A) Kinetics of inhibition by 0.15 μM ‘8219 and 0.7 μM ‘8090 (representative experiment). 5-HT transport into HeLa cells transfected with rSERT was non-competitively inhibited by both compounds. There was a small but statistically insignificant increase in KM with ‘8219 (0.69 ± 0.25 μM (SEM), n=6) and a decrease with ‘8090 (0.47 ± 0.05 μM, n=5) compared with uninhibited control (0.59 ± 0.18 μM, n=8). P values for paired t-tests were 0.99 and 0.18, respectively. Vmax was significantly decreased for both compounds from 1.7 ± 0.25 pmol/m/well for control (n=8) to 1.1 ± 0.2 pmol/m/well (n=6) for ‘8219 and 0.69 ± 0.1 pmol/m/well (n=5) for ‘8090. P values for paired t-tests were 0.018 and 0.011, respectively. (B) Efflux of accumulated [3H]5-HT induced by extracellular unlabeled 20 μM 5-HT, 10 μM ‘8219 or 10 μM ‘8090. 5-HT induced marked efflux of radiolabel, 8.3 ± 1.1 fmol/m (SEM)(n=6), relative to control (no addition) 0.63 ± 0.39 fmol/m (P=7×10⁻⁴ in 2-sample t-test, n=6). ‘8219 slightly increased efflux (1.8±0.6 fmol/m (SEM) but the increase was not significant (P=0.18, n=6) and ‘8090 barely increased efflux (0.12±0.09 fmol/m (SEM)(P=0.25, n=5). (C) Na+ and Cl− increased ‘8219 affinity in equilibrium displacement of [125I]β-CIT (representative experiment). Membranes from cells expressing SERT were incubated with 0.1 nM [125I]β-CIT and the indicated concentrations of ‘8219 in PBS/CM (control, blue line and circles), PBS/CM in which Na+ was replaced with NMDG+ (black line and circles) or Cl− was replaced with isethionate (red line and circles). The presence of Cl− increased ‘8219 inhibitory potency over 4-fold, from a KI of 21 ± 3 nM to 4.8 ± 1.0 nM (SEM) (n=4, P=0.001). Na+ increased ‘8219 inhibitory potency 131-fold, from a KI of 527 ± 143 nM to 4.0 ± 0.4 nM (SEM) (n=4, P=0.004).
