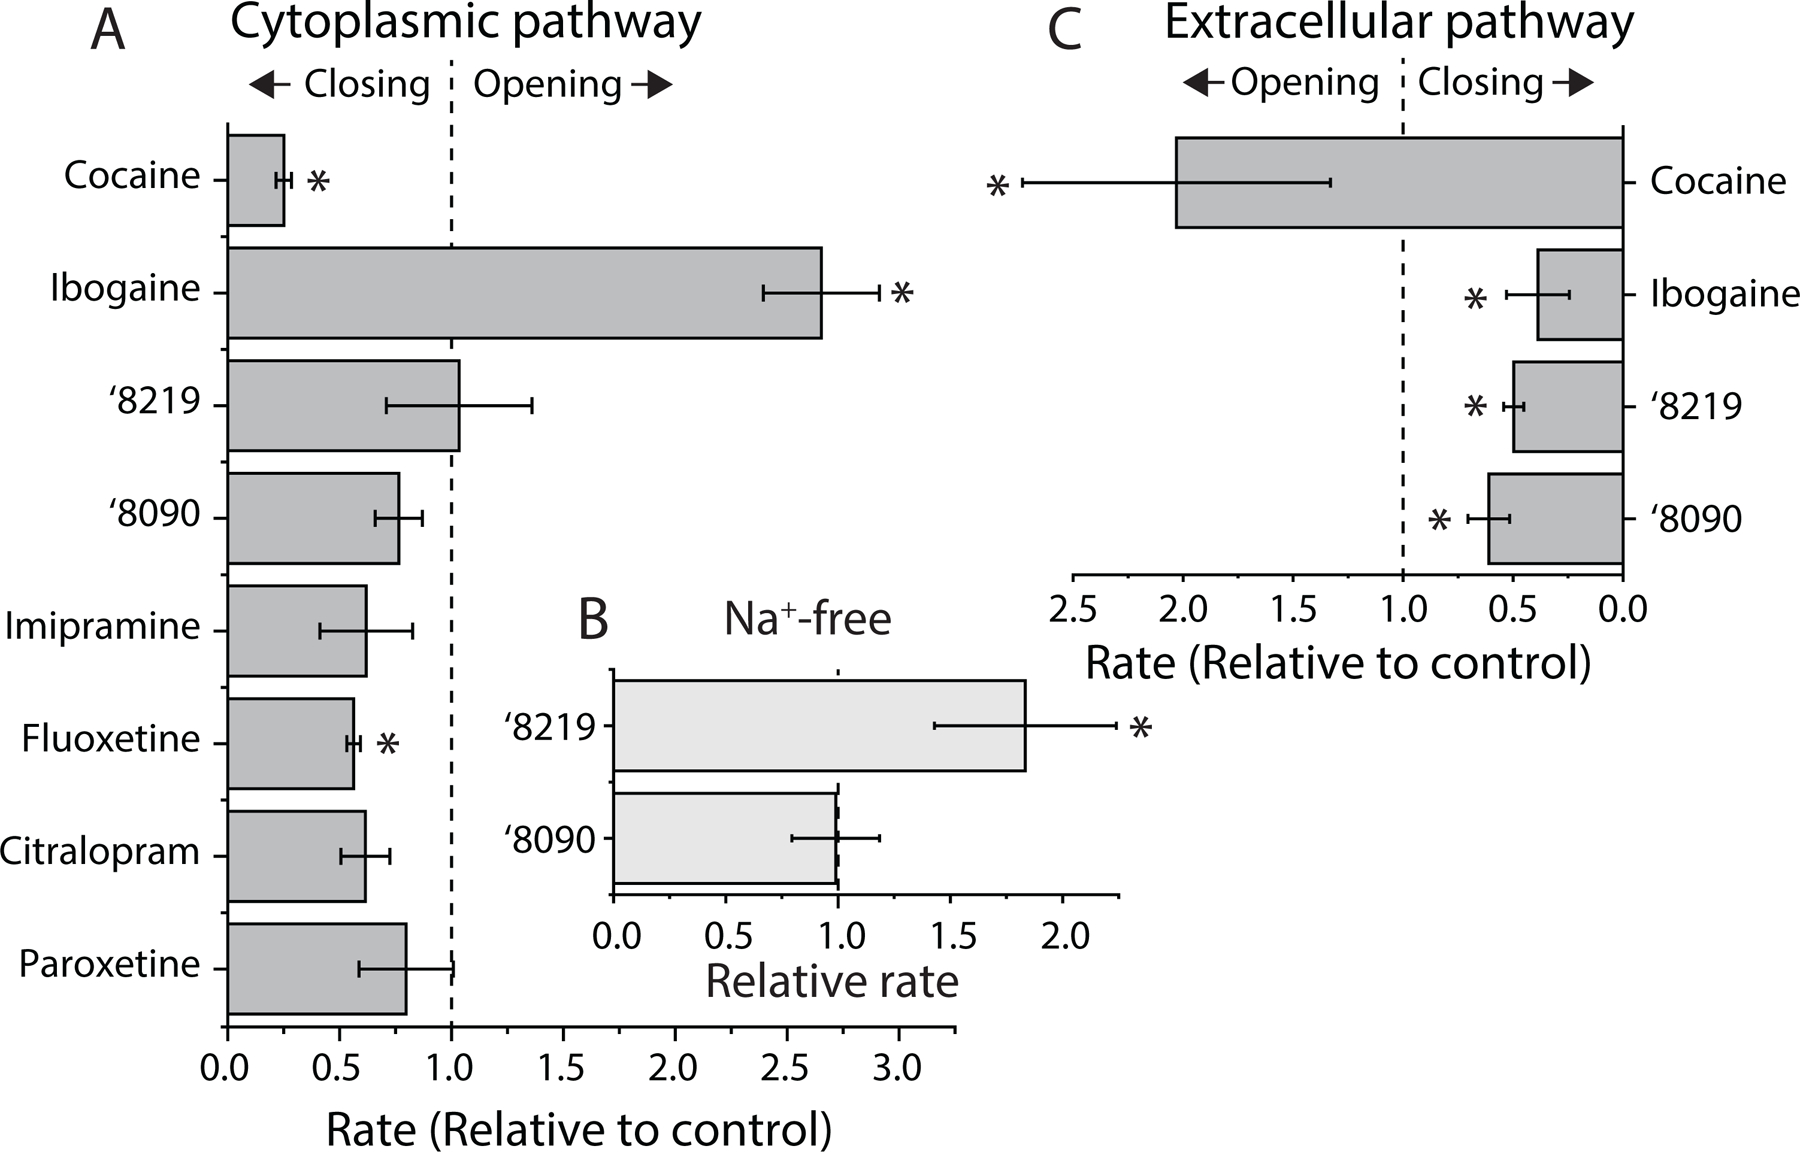
Figure 3. Influence of ‘8219, ‘8090 and ibogaine on SERT conformation.

(A) Effects on Cys277 reactivity in the cytoplasmic pathway. Rates of Cys277 modification in membranes from HeLa cells expressing SERT-S277C by MTSEA was measured by the decrease in β-CIT binding activity after treatment with MTSEA in the presence of the indicated compounds (cocaine, 10 µM, n=7; ibogaine, 10 µM, n=10; ‘8219, 0.05 µM, n=3; ‘8090 0.15 µM, n=4; imipramine, 0.6 µM, n=3; fluoxetine, 0.13 µM, n=3; citalopram, 0.03 µM, n=3; paroxetine, 0.02 µM, n=3). The reference compounds cocaine and ibogaine are shown at the top, and several clinically used antidepressants are shown at the bottom of the plot. Between them are ‘8219 and ‘8090. The control rate was 75 ± 15 s−1M−1 (n=18) and error bars represent SEM. (B) Effects on Cys277 reactivity in the absence of Na+ (replaced by NMDG). Rates were measured as above for control (n=6), ‘8219 (2 µM, n=6) and ‘8090 (2 µM, n=5). The control rate was 26 ± 5 s−1M−1 and the error bars represent SEM. ‘8219 significantly (P=0.04) increased the rate relative to control. (C) Effects on Cys107 reactivity in the extracellular pathway. Rates of Cys107 modification in HeLa cells expressing SERT-Y107C was measured by the decrease in residual transport activity after treatment with MTSET in the presence of the indicated compounds, each present at a saturating concentration (10x KD). Rates were measured as above for control (n=8), cocaine (n=3), ibogaine (n=4), ‘8219 (n=7) and ‘8090 (n=4). The control rate was 122 ± 14 s−1M−1. *=P<0.05 (paired t-test).
