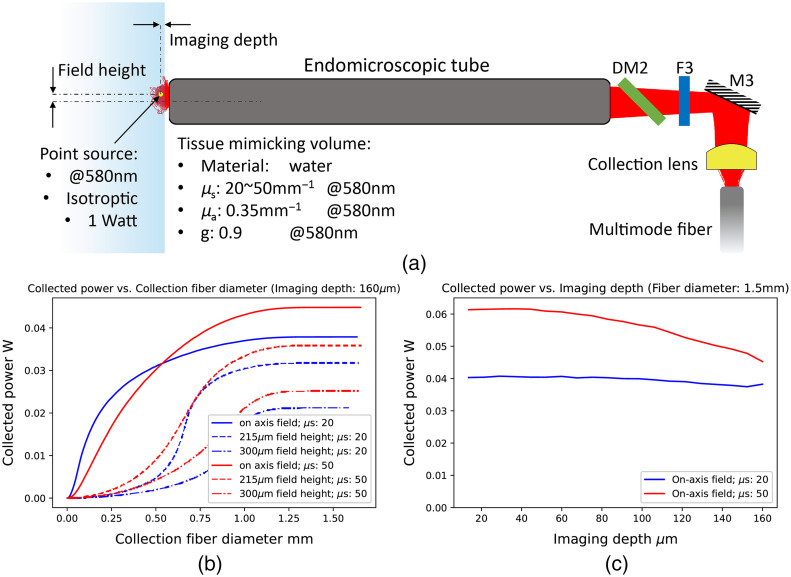
Fig. 2.
(a) Schematic diagram of the non-descanned collection channel. Light scattering in the tissue-mimicking volume is also drawn. The point source represents the emission point of the nonlinear signals. The field height is a distance of the source to the optical axis. The imaging depth relates to the distance from the point source to the volume surface. (b) The collected power for different sizes of the collection fiber. Imaging depth was set to . Blue and red lines represent results when is and . Solid, dash, and dot-dash lines represent results when field heights are on-axis, and . (c) The collected power in different imaging depths. The multimodal fiber core was set 1.5 mm in diameter. Blue and red indicates two cases of the scattering coefficients and , respectively.

