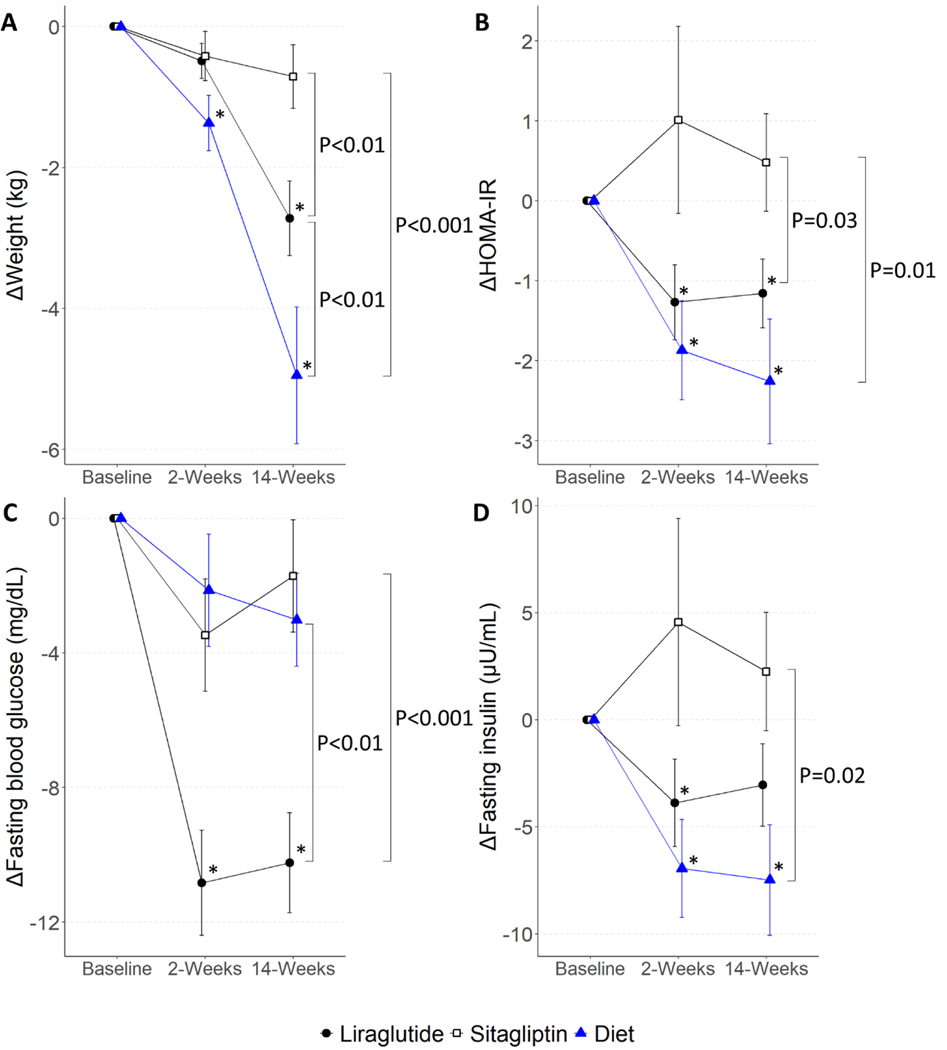
Figure 1. The Effect of Treatment on Weight, Fasting Blood Glucose, Fasting Insulin, and Insulin Resistance.
Plots show mean ± SEM for (A) weight, (B) HOMA-IR, (C) fasting blood glucose, and (D) fasting insulin at 2 and 14 weeks of treatment as change from baseline. Asterisk (*) symbols indicate P<0.05 for estimates of change from baseline, and brackets indicate difference between treatments at 14 weeks. HOMA-IR indicates Homeostatic Model Assessment of Insulin Resistance.

