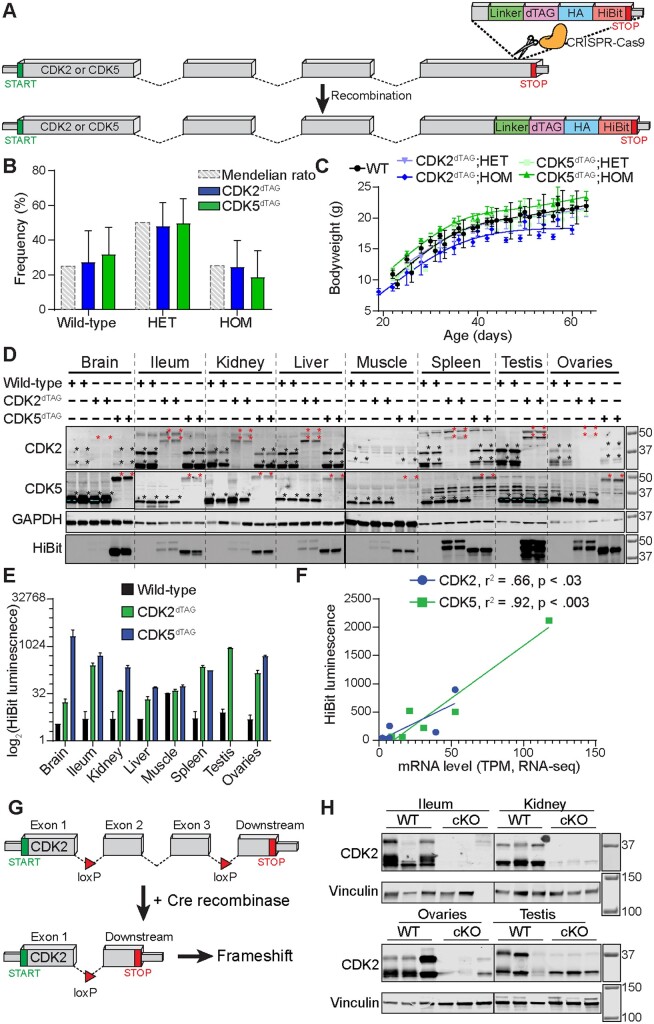
Figure 1.
Derivation and validation of CDK2dTAG and CDK5dTAG knock-in mice. A, Knock-in of the dTAG onto the C-terminus of Cdk2 and Cdk5 in the germline of C57BL/6J mice. Cartoon diagram of the strategy to generate dTAG knock-in mice. A DNA sequence encoding a linker, the dTAG, an HA tag and a HiBit sequence were knocked onto the C-terminus of Cdk2 or Cdk5 in the germline of C57BL/6J mice using CRISPR/Cas9 and homology-directed repair. Dashed lines represent introns, boxes represent exons. Not drawn to scale and all exons/introns are not included for illustrative purposes. B, HET × HET crosses of CDK2dTAG or CDK5dTAG mice yield pups with Mendelian ratios. Mendelian ratio is the expected genotype frequency from crossing heterozygous mice. HET, heterozygous; HOM, homozygous. n > 17 litters for CDK2dTAG and CDK5dTAG. Data are displayed as averages ± standard deviations (SDs). C, Developing HOM CDK2dTAG mice tend to weigh less than CDK5dTAG or WT mice. Bodyweight of developing wild-type (WT), CDK2dTAG and CDK5dTAG mice. n > 3 mice for all data points, n > 6 for most data points. Lines fit using a smoothing spline with 4 knots in GraphPad prism. D, CDK2dTAG and CDK5dTAG mice have decreased expression of the dTAG fusion protein. Western blot for CDK2 and CDK5 and far western for the HiBit tag in HOM mice for the indicated genotype. Each lane represents an individual mouse. Highlighted regions are saturated and asterisks at the top right of bands represent the presumed CDK2 or CDK5 proteins (black or red for untagged or dTAG’d proteins, respectively). Mice were approximately 6–10 weeks old. Molecular weight markers are in kDa. E, Expression of CDK2dTAG and CDK5dTAG fusion proteins by the HiBit assay in various tissues. Protein levels of CDK2 and CDK5 as read out via a plate-based HiBit assay. Values are averages ± SD, n= 2. Same protein lysate as from (D). F, Strong correlation between mRNA levels of CDK2 or CDK5 in WT mice and CDK2dTAG or CDK5dTAG protein levels, respectively, in dTAG knock-in mice. Correlation between HiBit signal and mRNA levels (RNA-seq) for CDK2 and CDK5. Tissues shown are brain, ileum, kidney, liver, muscle, testis, and ovaries. For the brain, the HiBit signal is for the entire brain and mRNA level is the average transcripts per million (TPM) from RNA-seq on the cerebellum and cerebral cortex. HiBit data is from (E). G, Knock-in of loxP sites flanking exon 2 and 3 to generate Cdk2 conditional KO mice. Cartoon diagram of the strategy to delete Cdk2. Exons 2 and 3 were flanked by loxP sites, leading to deletions of exon 2 and 3 and a frameshift in CDK2 upon Cre-mediated recombination. Dashed lines represent introns, boxes represent exons. Not drawn to scale and all exons/introns are not included for illustrative purposes. H, Treatment of CDK2 cKO mice with tamoxifen causes loss of CDK2 protein expression. CDK2 cKO mice (genotype Cdk2fl/fl; Rosa26tm(Cre/ERT2)+/−) or “wild-type” mice (genotype Cdk2fl/fl; Rosa26tm(Cre/ERT2−/−)) were administered 75 mg/kg tamoxifen orally for 6 days. Twelve days later tissues were analyzed for CDK2 protein expression by immunoblot. Molecular weight markers are in kDa.

