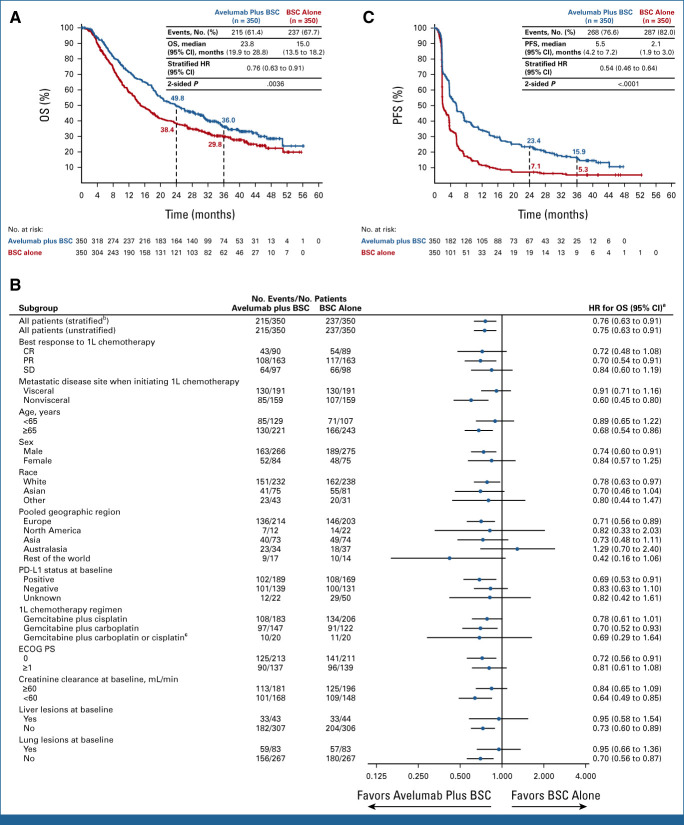
FIG 1.
Efficacy analyses showing (A) Kaplan-Meier estimate of OS in the overall population, (B) forest plot of OS subgroup analysis, and (C) Kaplan-Meier estimate of investigator-assessed PFS in the overall population. (B) Unless otherwise stated, all analyses are unstratified, and analyses in subgroups with unreported or unknown creatinine clearance or 1L chemotherapy regimen are not shown because of the small number of patients in these subgroups. aHRs and CIs were calculated using a Cox proportional hazards model. bStratified by best response to 1L chemotherapy (CR or PR v SD) and metastatic disease site when initiating 1L chemotherapy (visceral v nonvisceral). cPatients who switched platinum regimens while receiving 1L chemotherapy. 1L, first-line; BSC, best supportive care; CR, complete response; ECOG PS, Eastern Cooperative Oncology Group performance status; HR, hazard ratio; OS, overall survival; PFS, progression-free survival; PR, partial response; SD, stable disease.

