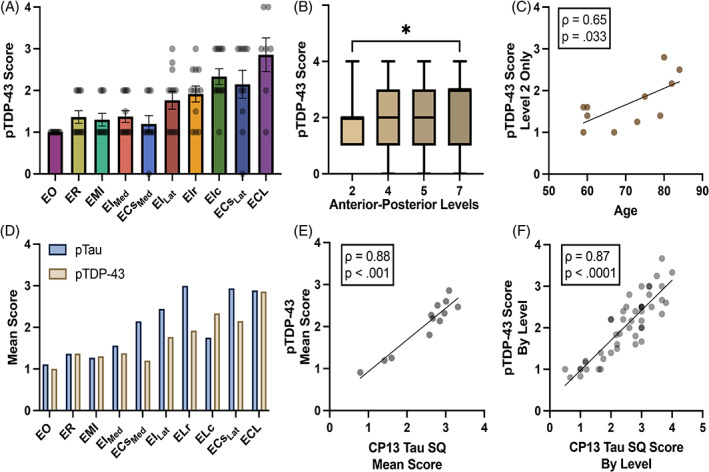
FIGURE 3.

Semi‐quantitative pTDP‐43 and p‐tau scores in the EC: (A) Graph shows mean pTDP‐43 semi‐quantitative scores across all EC subfields and cases (n = 12). Posterior and lateral subfields ECL, ELc, and ECsLat presented the highest pTDP‐43 burden; EO displayed the lowest. Error bars represent standard error mean. (B) pTDP‐43 semi‐quantitative scores are shown across four anterior–posterior levels with horizontal lines that represent the median and whiskers the min/max value. pTDP‐43 pathology burden peaked at the posterior entorhinal (level 7), significantly differing from anterior pathology (level 2) (p = 0.035). (C) Significant Spearman's correlation between anterior pathology at level 2 and age of the individual cases (Spearman's correlation; ρ(9) = 0.65, p = 0.033). (D) Mean pTDP‐43 and p‐tau pathology semi‐quantitative scores compared across the EC subfields. Lateral‐posterior regions (subfields ECL, ECsLat, ELr, and ELc) showed the highest pathology burden for both pTDP‐43 and p‐tau. P‐tau was higher than TDP‐43 in score magnitude in every subfield, except ELc and EMI. (E) Spearman's correlation between mean pTDP‐43 and p‐tau scores per case was strongly significant (Spearman's correlation; ρ(10) = 0.88, p < 0.001). (F) Spearman's correlation comparing mean individual level pTDP‐43 and p‐tau scores per case was also strongly significant (Spearman's correlation; ρ(46) = 0.87, p < 0.0001). *Significance = p < 0.050.
