FIGURE 4.

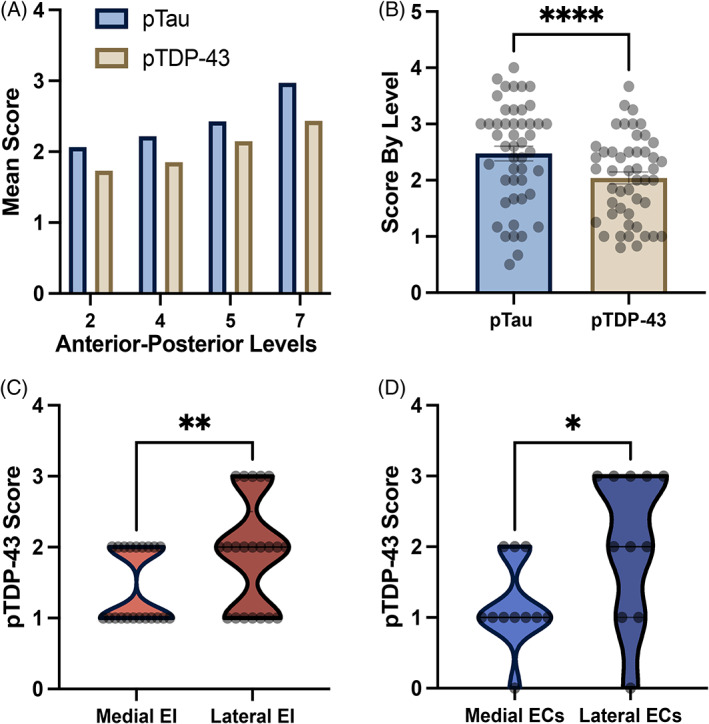
Semi‐quantitative pTDP‐43 and p‐tau scores: (A) Mean semi‐quantitative scores for pTDP‐43 and p‐tau across four anterior–posterior levels. Stepwise rise was demonstrated in both pathologies, peaking posteriorly at level 7. (B) Mean semi‐quantitative scores for pTDP‐43 and p‐tau based on respective immunostains. P‐tau shows significantly higher overall scores (Wilcoxon; W = −842.00, p < 0.0001). Error bars represent standard error mean. (C) We found a significant difference between medial and lateral EI semi‐quantitative scores, with lateral EI presenting a higher pathology burden (Wilcoxon; W = 55.00, p = 0.002). (D) Significant difference between medial and lateral ECs semi‐quantitative scores, with lateral ECs showing a higher pathology burden (Wilcoxon; W = 38.00, p = 0.027). *Significance = p < 0.050.
