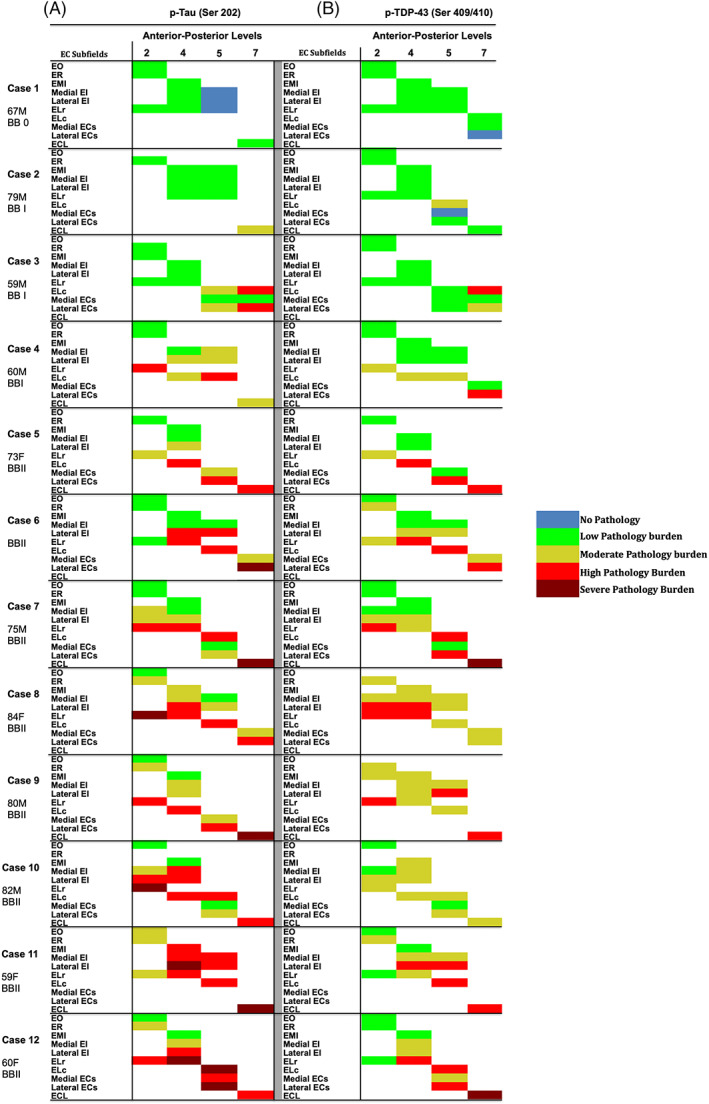
FIGURE 5.

Heat‐map of p‐tau and pTDP‐43 semi‐quantitative scores in entorhinal subfields (n = 12): Figure 5 shows a color‐coded heat‐map of entorhinal subfields for p‐tau and pTDP‐43 pathology semiquantitative scores across cases, levels, and arranged by BB stages (0–II). The left panels show p‐tau SQ scores and the right panels show pTDP‐43 SQ scores. Color code reflects semi‐quantitative scores: blue (score 0, no pathology), green (score 1, isolated pathology inclusions), yellow (score 2, moderate pathology burden), red (score 3, high pathology burden), burgundy (score 4, severe pathology burden). Cases 1 and 2 lacked p‐tau or pTDP‐43 pathology altogether in some entorhinal subfields. Green labels were evenly distributed among the BB0 and BBI cases, and predominantly in medial‐anterior subfields in the BBII cases. Yellow label distribution depended on BB stage, with higher prevalence in anterior regions as overall pathology burden worsened. With few exceptions, red labels were observed predominantly in the lateral posterior EC subfields. Burgundy labels represent severe pathology burden (score 4) and were typically found in the lateral‐posterior subfields among the most affected cases.
