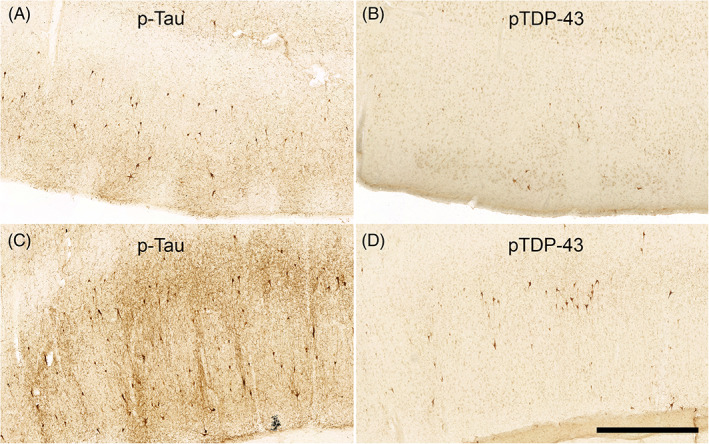
FIGURE 6.

Immunostaining p‐tau and pTDP‐43 shows Qualitative Differences in the Same Subregions: Figure 6 shows representative examples of qualitative differences in the magnitude of p‐tau and pTDP‐43 pathology in the same subregions from the same case (case 12, BBII). Panels A and B show, respectively, p‐tau and pTDP‐43 immunostained tissue from the EC. Panels C and D show, respectively, p‐tau and pTDP‐43 immunostained tissue from the perirhinal cortex. CP13 p‐tau immunostained tissue in the EC and perirhinal cortex displayed a higher pathological burden than the pTDP‐43 burden seen in the same case regions, a widespread phenomenon among the rest of the cases. Magnification bar = 1 mm.
