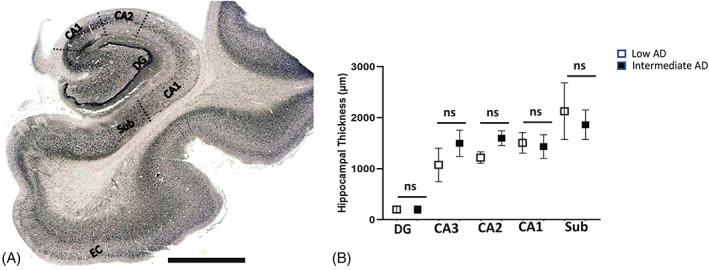
FIGURE 1.

Global view of the hippocampus. Strategy of the quantification of Aβ, ptau, and the inflammasome components is shown in the diagram. (A) Dotted lines represent the boundaries that were made in hippocampal regions of the dentate gyrus (DG); Cornu Ammonis Field 3 (CA3); Cornu Ammonis Field 2 (CA2); Cornu Ammonis Field 1 (CA1); and the subiculum (sub). (B) Comparison of hippocampal formation thickness between low AD and intermediate AD. Scale = 1 mm; ns = not significant; micron = μm.
