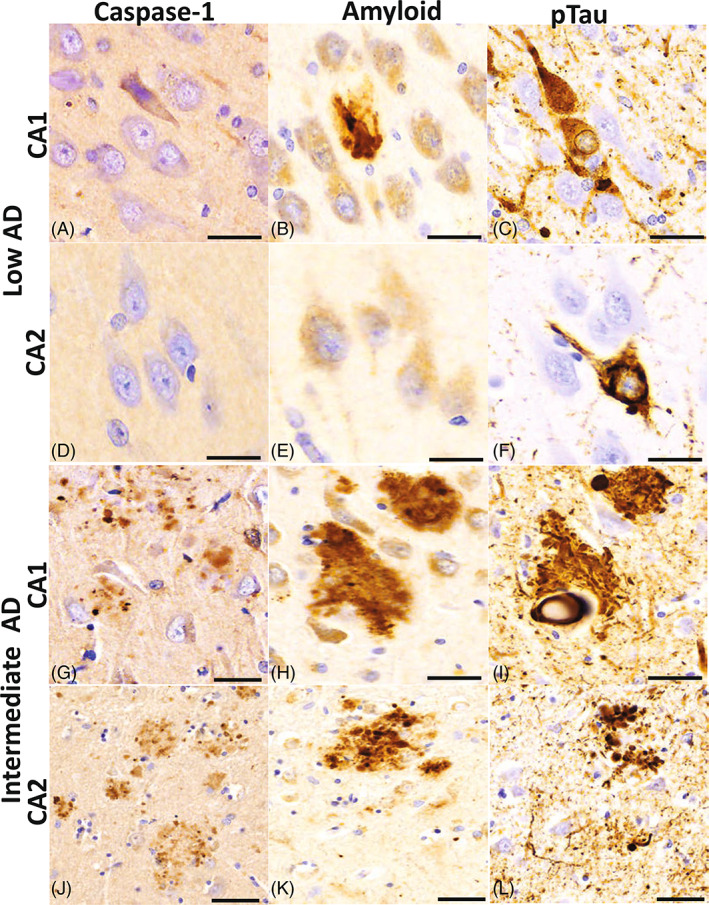
FIGURE 6.

Caspase‐1 protein expression in the CA1 and CA2 hippocampal regions. Distribution of caspase‐1 adjacent to neurons and in the tissue parenchyma in clusters that resemble amyloid deposits. The CA1 (A) region of the low AD cases shows a sparse cluster of caspase‐1 in the vicinity of an Aβ plaque (B) and a neurofibrillary tangle and neuritic threads (C). In CA2, a region less affected by low AD neuropathological changes, there is no caspase‐1 immunoreactivity defined (D) nor Aβ positive plaques (E) but there is an occasional neurofibrillary tangle present (F). Intermediate AD cases have denser cluster expression of caspase 1 in both the CA1 (G) and CA2 (J) regions in areas where moderate densities of Aβ plaques (H and K) and neurofibrillary tangles and threads are noted (J and L). Beta‐amyloid (Aβ); hyperphosphorylated (ptau); Cornu Ammonis Field 2 (CA2); Cornu Ammonis Field 1 (CA1); Alzheimer's disease (AD); scale bar = 30 μm.
