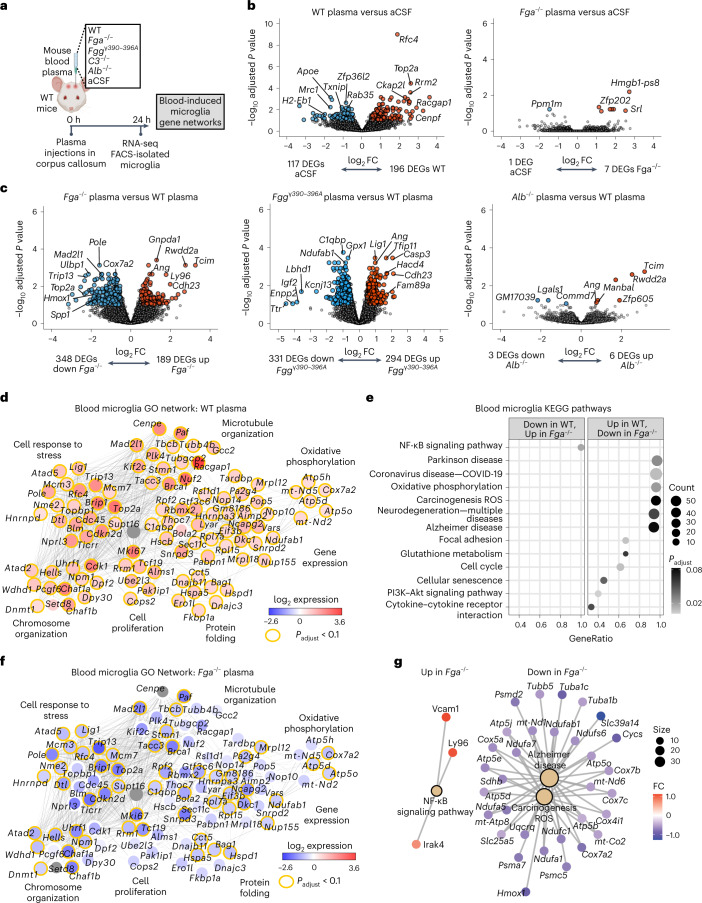
Fig. 1. Transcriptional profiling of ligand-selective activation of blood-induced microglial responses in vivo.
a, Schematic of experimental design for transcriptional profiling of blood-induced microglial responses. b,c, Volcano plots of DEGs from RNA-seq analysis of sorted microglia from plasma-injected brains. Comparisons between DEGs in microglia of brains injected with WT plasma versus aCSF or Fga−/− plasma versus aCSF (b) and Fga−/− plasma versus WT plasma, Fggγ390–396A versus WT plasma or Alb−/− versus WT plasma (c) are shown. The log2 FC and −log10 adjusted P value cutoffs were log2 FC > 0.5, adjusted P < 0.1 with Wald test followed by Benjamini–Hochberg (BH) test correction. Top DEGs are shown. Data are from n = 6 Fga−/−, n = 6 WT, n = 6 aCSF and n = 8 Alb−/− mice. d, Coexpression GO networks upregulated in microglia by WT plasma. Adjusted P value <0.1 by hypergeometric test and BH test correction. e, GSEA plots of top upregulated and downregulated pathways in microglia from Fga−/− plasma-injected versus WT plasma-injected brains. Adjusted P value <0.1 by permutation test with BH test correction. f, Overlay of blood microglia GO network with microglial gene expression values from Fga−/− plasma-injected mice. Red shading, genes upregulated in microglia by WT plasma; blue shading, genes downregulated in microglia by Fga−/− plasma; orange border, *P < 0.1 (Wald test followed by BH test correction). g, Coexpression KEGG pathway networks of top upregulated and downregulated pathways in microglia from Fga−/− plasma-injected versus WT plasma-injected brains. Adjusted P < 0.1 by hypergeometric distribution and BH test correction. Padjust, adjusted P value. Created with BioRender.com.

