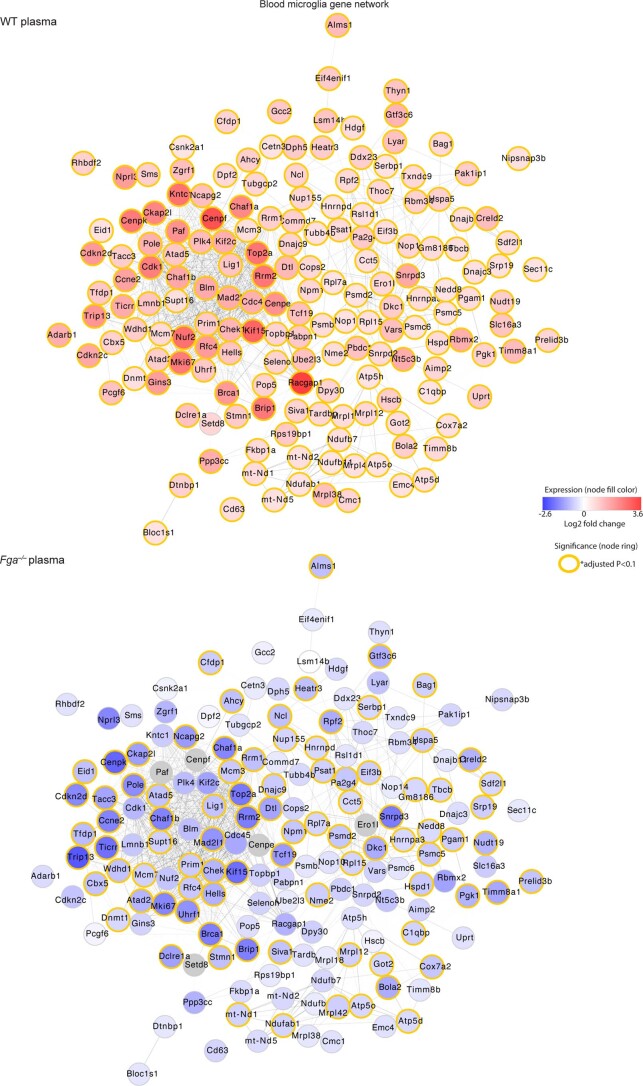
Extended Data Fig. 3. Blood-induced microglial gene co-expression network.
Top, Co-expression gene network of 196 DEGs upregulated in microglia by WT plasma compared to aCSF control. Bottom, overlay of blood gene network with microglial gene expression values from Fga–/– plasma-treated mice. Red shading, genes upregulated in microglia; blue shading, genes downregulated in microglia; the orange boarder indicates significance of P < 0.1 (Wald test following by Benjamini-Hochberg multiple test correction). Data are from n = 3 biological replicates per group, with two mice pooled per replicate.

