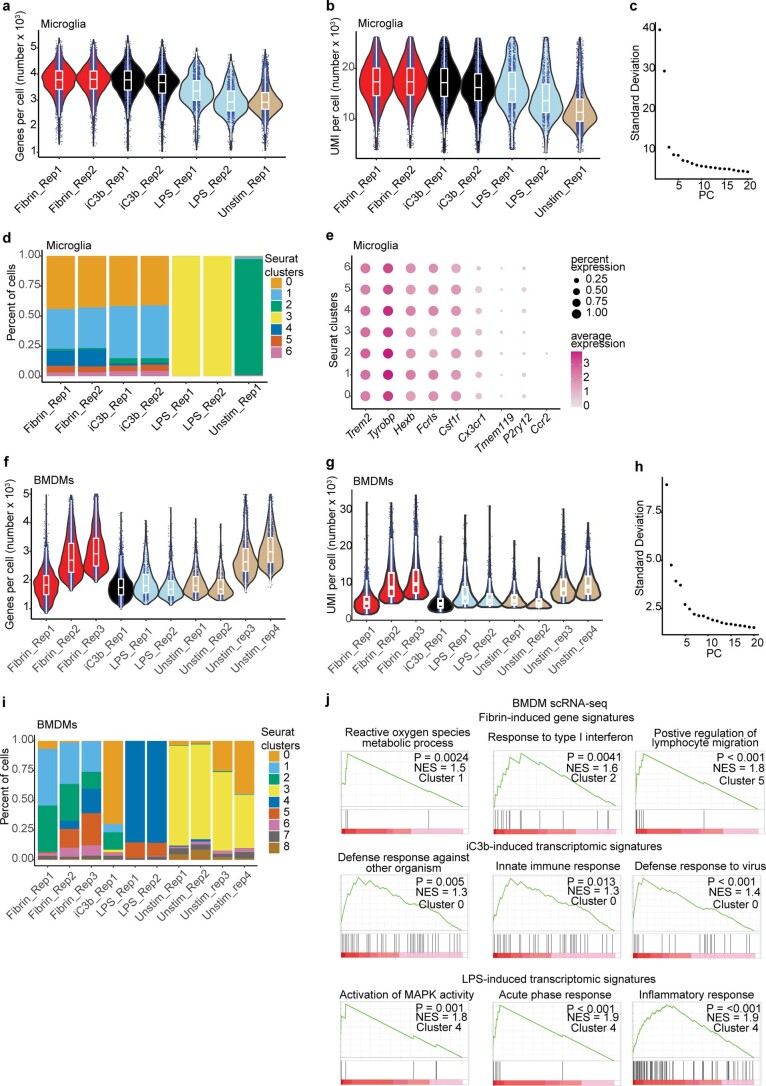
Extended Data Fig. 4. Quality control for primary microglia scRNA-seq and BMDM scRNA-seq datasets.
a, b, Violin plots of number genes (a) and unique molecular identifiers (UMI, b) per cell post-normalization and shown for each biologically independent sample from scRNA-seq of primary microglia stimulated with fibrin, iC3b, LPS or left unstimulated. Data are from two biologically independent samples of fibrin, two biologically independent samples of iC3b, two biologically independent samples of LPS, and one biologically independent sample of unstimulated primary microglia. c, Elbow plot of top PC used to select for clustering analysis. d, Distribution of cells in each biologically independent sample across each seurat clusters. e, Dot plot of selected microglial gene markers across each cluster from scRNA-seq dataset of primary microglia as shown in Fig. 3a. Average gene expression and cell population expression is depicted as log expression and percent, respectively. f, g, Violin plots of number genes (f) and UMI (g) per cell post-normalization and shown for each biologically independent sample from scRNA-seq of primary BMDMs stimulated with fibrin, iC3b, LPS or left unstimulated. Data are from three biologically independent samples of fibrin, one biologically independent sample of iC3b, two biologically independent samples of LPS and four biologically independent samples of unstimulated BMDMs. h, Elbow plot of top PC used to select for clustering analysis. i, Distribution of cells in each biologically independent sample across each seurat clusters. j, Gene-set enrichment plots of top GO terms for a given cluster (adjusted P value < 0.05 with BH correction). Violin plots depict minimum, maximum, and median expression, with points showing single-cell expression levels (a, b, f, g). Box plots show the 1st to 3rd quartiles (25–75% box bounds) with median values indicated and upper and lower whiskers extending to 1.5*inter-quartile range (a, b, f, g).

