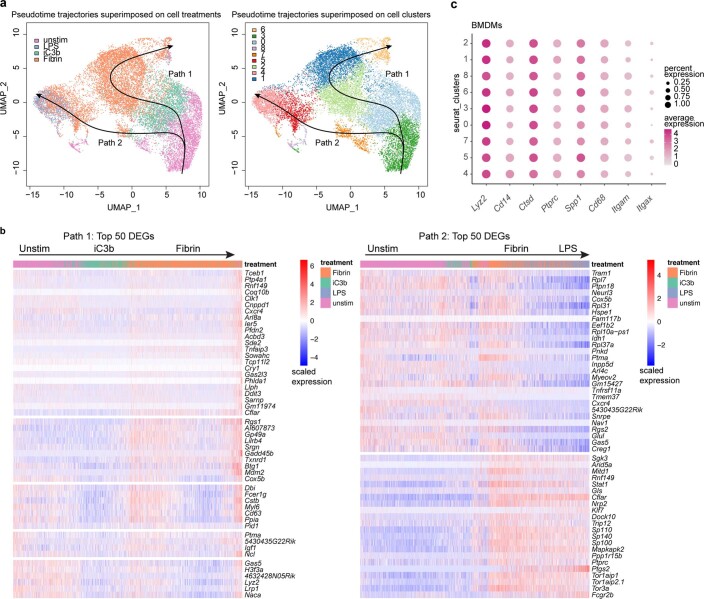
Extended Data Fig. 5. Pseudotime trajectory analysis of scRNA-seq BMDM profiles.
a, UMAP plots of BMDM scRNA-seq profiles colored by treatment (left) or cluster (right) as shown in Fig. 3a, overlaid with pseudotime trajectory analysis with Slingshot. Black arrows indicate inferred trajectories with unstimulated (cluster 3) defined as starting point. b, Heat map of single cell gene expression patterns across pseudotime trajectories of top 50 DEGs. c, Dot plot of selected macrophage gene markers across each cluster from scRNA-seq datasets of primary BMDMs as shown in Fig. 3a. Average gene expression and cell population expression is depicted as log expression and percent, respectively.

