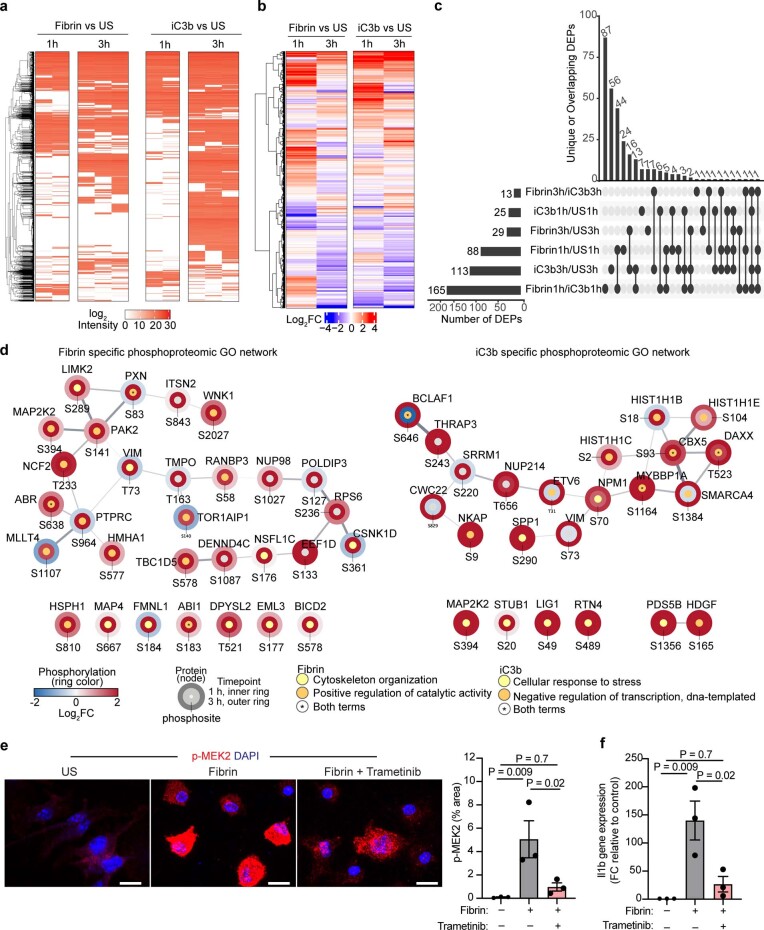
Extended Data Fig. 6. Network analysis and functional validation of phoshoproteomic dataset.
a, Log2 intensity of phosphorylated peptides (rows) for each biological replicate (columns) across stimulation comparisons at each time point. Cells colored white indicate not detected. Unstimulated, US. Data from n = 2 (Fibrin 1 h), n = 2 (iC3b 1 h), n = 3 (US 1 h), n = 3 (Fibrin 3 h), n = 3 (iC3b 3 h), n = 3 (US 3 h) independent experiments. b, Log2FC of phosphorylated peptides between fibrin vs US and iC3b vs US at each timepoint. c, UpSet plot showing a matrix layout of DEPs specific to a treatment (single filled circle with no vertical lines) or shared between treatment (filled circles connected with vertical lines) comparisons. Bar plots of the unique or overlapping DEPs in treatment comparison (top) and the number DEPs for each treatment comparison (left). Phosphorylation sites considered DEPs (FDR < 0.05 and abs(log2 FC) > 1.5) are shown. Student’s t-test with BH correction. d, Phosphoproteomic GO network for fibrin or iC3b. Phosphorylation changes (log2 FC) depicted as blue-red scheme and timepoint (h) as rings. GO terms indicated by node fill color and protein interaction strength as edge thickness and opacity. e, Confocal microscopy of p-MEK2 staining in BMDMs left unstimulated or stimulated for 90 min with fibrin alone or in the presence of trametinib. Nuclei labeled with DAPI. Scale bar, 50 μm. Quantification of p-MEK2 for n = 3 independent experiments in duplicates. P < 0.05 as determined by two-tailed unpaired t-test. f, Quantitative PCR of Il1b expression in BMDMs unstimulated or stimulated for 6 h with fibrin alone or in the presence of trametinib. Data are from n = 3 independent experiments performed in duplicates. P < 0.05 as determined by one-way ANOVA with Tukey’s multiple comparisons test.

