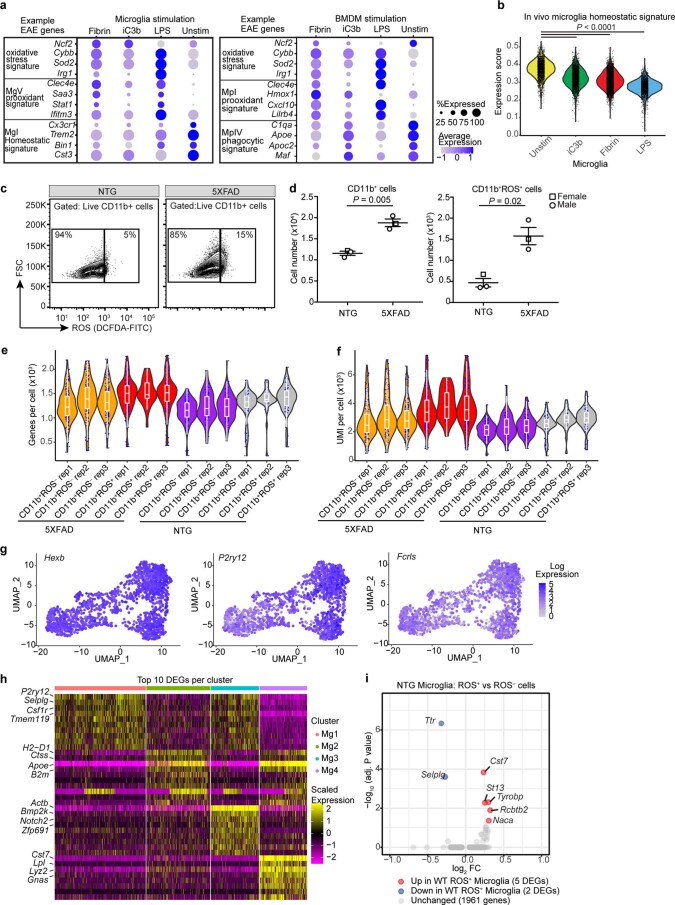
Extended Data Fig. 8. Ligand-induced profile overlays with EAE innate immune cell signatures, and quality control data related to Fig. 6.
a, Dot plot of selected gene markers across scRNA-seq datasets of primary microglia or BMDMs unstimulated or stimulated with fibrin, iC3b, or LPS. Gene expression is depicted as scaled log-normalized expression. b, Violin plot of primary microglia overlaid with microglial homeostatic gene signature from healthy mice as previously identified31. Treatments in x-axis are rank ordered from highest to lowest expression. P < 0.0001 by one-way ANOVA with Tukey’s multiple comparison test. c, Flow cytometry plots of live CD11b+ROS– and live CD11b+ROS+ cells from brains of 12-month-old 5XFAD and NTG mice. Cell population (%) shown inside plot. Data representative of two independent experiments. d, Quantification of total live CD11b+ cells and CD11b+ROS+ cells from brains of 12m 5XFAD and NTG mice. Data from n = 3 mice per genotype shown as mean ± s.e.m. ROS production assessed via DCFDA (c,d). P < 0.05 as determined by two-tailed, unpaired t-test with Welch’s correction. e, f, Violin plots of number genes (e) and UMI (f) per cell post-normalization, shown for each biologically independent sample for 5XFAD and NTG Tox-seq analysis. Data from n = 3 mice per condition. Box plots show the 1st to 3rd quartiles (25–75% box bounds) with median values indicated and upper and lower whiskers extending to 1.5*inter-quartile range. g, UMAP plots as shown in Fig. 6a overlaid with microglial gene marker expression. Expression depicted as log-fold change expression. h, Heat map of top DEGs per single cell cluster from 5XFAD Tox-seq dataset. Gene expression depicted as scaled z-score. i, Volcano plot of DEGs in microglia between CD11b+ROS+ compared to CD11b+ROS– cells in NTG mice. Dots depict average log2FC and -log10 adjusted P values (log2 > 0.25, adjusted P value < 0.05, MAST test with BH correction). Violin plots depict minimum, maximum, and median expression, with points showing single-cell expression levels (b, e, f).

